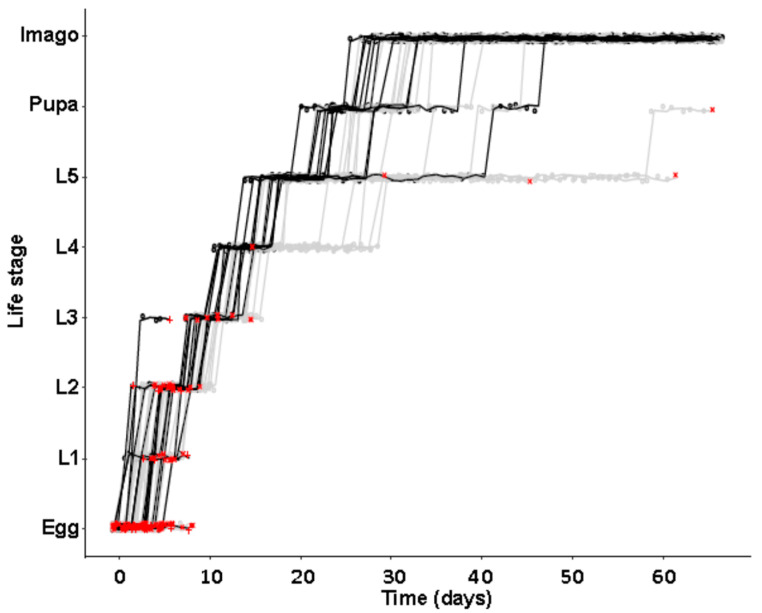
Figure 2.
Cumulative developmental time until the end of different life stages of aposymbiotic (grey dots and lines) versus symbiotic (black dots and lines) O. surinamensis beetles from the JKI-1 lines. Red ‘+’ and ‘×’ signs indicate death of symbiotic and aposymbiotic individuals, respectively. Significant differences were observed for transitioning from larval instars 3 to 4 and instar 4 to 5 after Wilcoxon rank sum test corrected for FDR following Benjamini–Hochberg (* = p < 0.05, all other comparisons p > 0.05).

