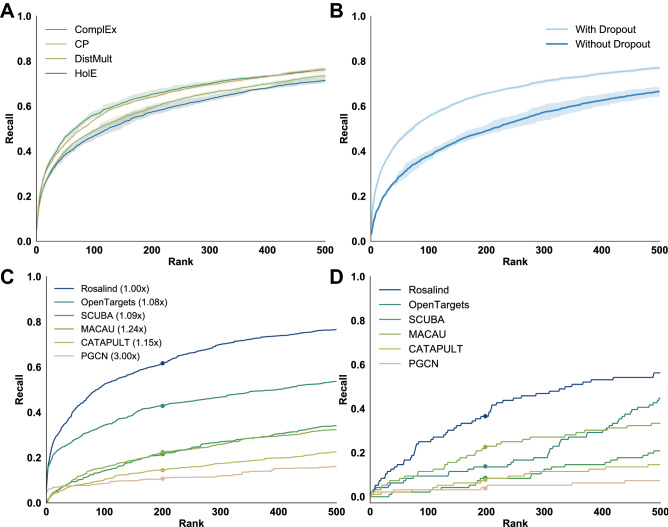
Figure 1.
Comparison with link prediction methods. (A) Performance comparison of decoders. The curves plot the mean recall on a held-out test set of gene proteins across the benchmark diseases for four widely-used tensor factorization algorithms. Shaded areas indicate +/- 1 standard deviation across 3 random seeds. As rank is increased, recall of the correct predictions monotonically increases, resulting in the characteristic curves seen here. (B) Performance both with and without dropout’s regularizing effects on the entity embeddings, indicating mean and +/- 1 standard deviation of recall on the held-out test set gene proteins. (C) Performance of Rosalind against other state-of-the-art gene prioritization methods for 198 diseases. As not all algorithms support predictions for all of the test diseases, a score multiplier shown here in parentheses is applied based on the number of correctly-grounded diseases to account for the missing recall values of unsupported diseases (e.g. if only half of all diseases could be mapped, a 2x multiplier was applied to recall). (D) Performance of Rosalind against other gene prioritization algorithms for the specific disease of Rheumatoid Arthritis. The discretized nature of the plot is due to recalling individual gene proteins at particular positions; unlike previous plots, this is not averaged across multiple diseases.

