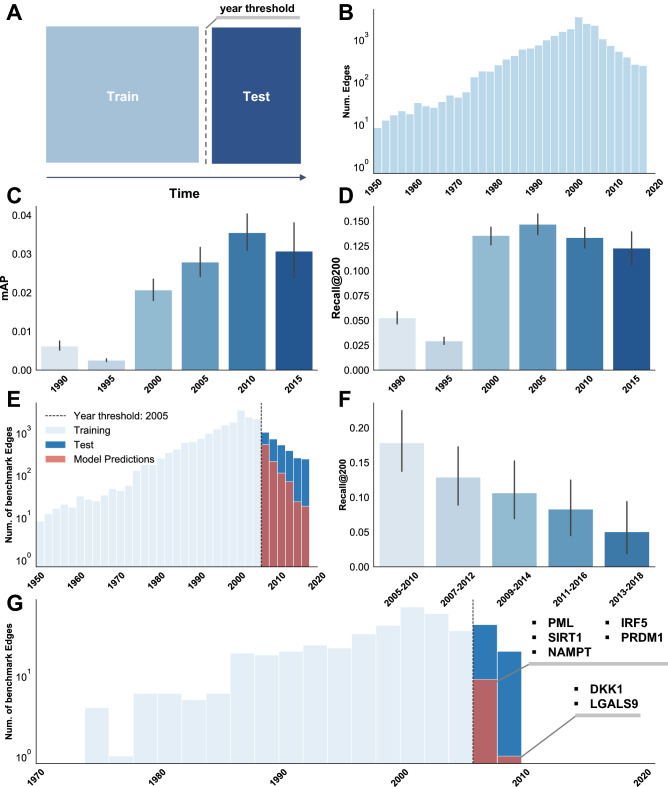
Figure 2.
Time-slicing results. (A) Schematic of the split between training and test data. (B) Histogram of Therapeutic Relationship Benchmark edges per year in the full training and test sets. Note that each data point denotes the first literature mention of each edge. (C) Rosalind mAP on a time-bound benchmark. The year thresholds used to separate training data from test data are shown on the x-axis. Time-bound test sets were limited to a 5-year window after but not including the year threshold (i.e. training data for Rosalind time-sliced at 2010 contains edges up to and including 2010, and test data includes edges from 2011 to 2015 inclusive). Rosalind was trained separately on each training dataset, and evaluated on each corresponding test set. Recall@200 for these splits is shown in (D). (E) Histogram of year-tagged Therapeutic Relationship Benchmark edges with 2005 year threshold indicated. In light blue are the edges that were in the training data, in dark blue is the test set. Benchmark targets correctly predicted by the time-sliced model are shown in red. Here, the time-bound benchmark is not used, rather, all benchmark edges beyond the year threshold are used for evaluation. (F) Drop in recall for a sliding window of 5-years, starting at 2005. Each time window is exclusive of the first year and inclusive of the last (i.e. a 2005-2010 time window includes all dates from 2006-2010 inclusive). (G) Shown in light blue is the therapeutic benchmark relation training data for RA. Shown in dark blue is the therapeutic benchmark relation test set for RA. The test set here is time bound to a 5 year time band (i.e. 2006-2010 inclusive). Genes highlighted here are the correctly identified benchmark targets in the top 500 Rosalind predictions for RA.

