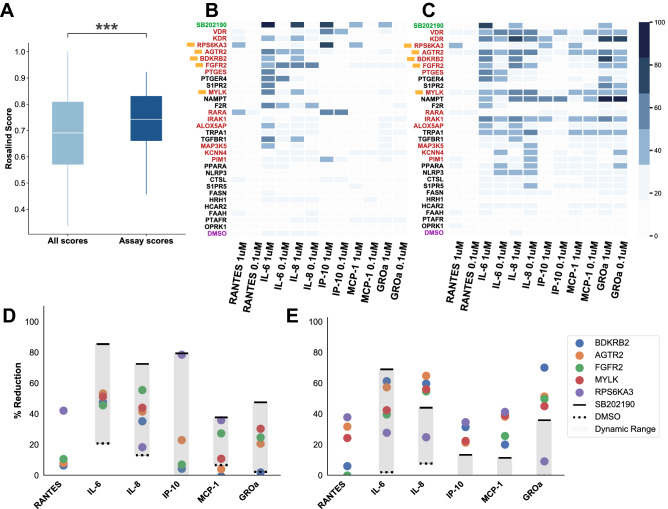
Figure 4.
Efficacy of top-scoring drug targets in inhibiting cytokine induction in patient-derived FLSs. (A) Distribution of Rosalind scores for targets of compounds tested in FLSs (dark blue), and of all targets (light blue). White horizontal lines indicate the median of the distributions. The box extends between the first and third quartile (the interquartile range). Whiskers extend to the ends of the distribution, excluding outliers. Significance was tested using a MWW test; ***0.001. (B) and (C) Heatmap of the percent inhibition by immunotoxic compounds for predicted targets, showing degree of inhibition of 6 cytokines at two concentrations (1M and 0.1M), in cells stimulated with TNF (B) and Poly(I:C) (C). In green is the positive control, SB202190, and in purple is the vehicle control, DMSO. In red are the top 14 initial hits, and the yellow squares indicate the 5 final hits of these 14 initial hits that show efficacy at 1 and 0.1M. (D) and (E) Percent reduction in 6 cytokines of interest of the 5 final hits (colored circles) for TNF and Poly(I:C) stimulation respectively at a compound concentration of 1M. Percent reduction induced by the positive control, SB202190, is indicated by the solid black lines. The vehicle control, DMSO, is indicated by dashed black lines. Shaded gray areas indicate the dynamic range, or assay window. Unexpectedly, there was no effect of the positive control on RANTES; for this reason, our assay window excludes RANTES in (C) and (D).

