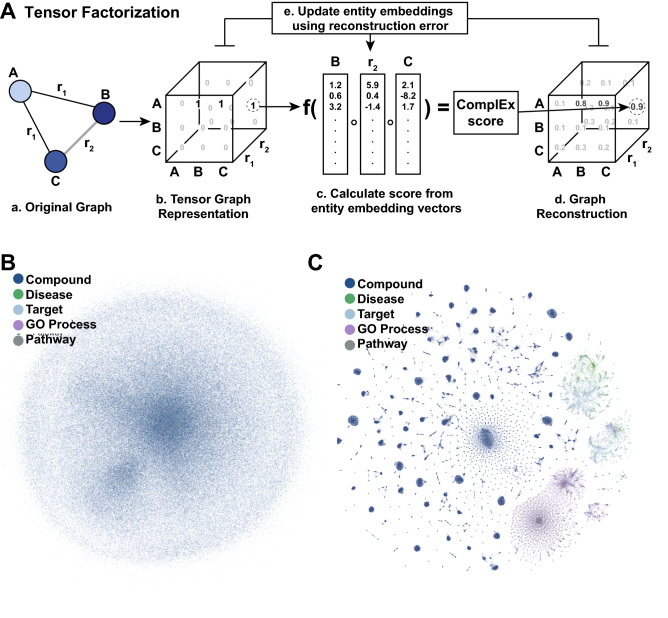
Figure 6.
Visualization of entity representations through Rosalind. (A) Shown here is a depiction of training through tensor factorization, using a graph consisting of three entities (A, B, and C), and two relations, and . Step (a) shows the original graph, with three entities connected via two relations. Step (b) shows the sparse tensor representation of this graph, with entities across two dimensions and relations along the third, and a 1 or 0 value for each coordinate, indicating whether an edge exists or does not exist, respectively. Step (c) shows the calculation of the ComplEx score for a single point in the tensor, that represents an entity-relation-entity edge, which is a function of the latent embeddings for the two entities and relation. The ComplEx score for each possible entity-relation-entity edge is calculated, and used to populate the graph reconstruction tensor (dense), shown in (d). Training involves calculating the reconstruction error, or the difference between the ComplEx score and the true 1 or 0 value from the original graph tensor. This error signal is then used to update the entity embeddings. (B) A tSNE representation of the embeddings in A before training; note the lack of structure. (C) A tSNE representation of the embeddings in B after training.

