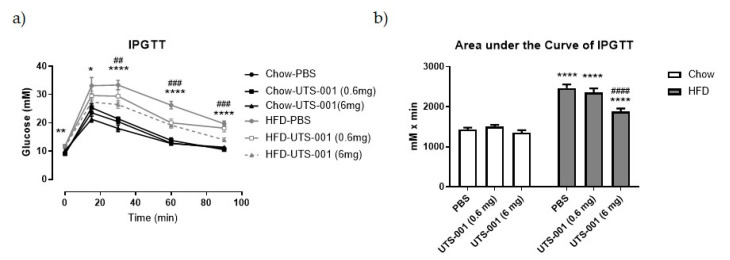
Figure 1.
(a) An intraperitoneal glucose tolerance test (IPGTT, glucose 2 g/kg) after 4 weeks of treatment. (b) Area under the curve (AUC) of the IPGTT in (a). Data are expressed as mean ± S.E.M, n = 7–12. Data were analysed using two-way ANOVA followed by post hoc Fischer’s LSD tests. In (a), ** p < 0.01, Chow-PBS vs. HFD-PBS at o min; * p < 0.05, Chow-PBS vs. HFD-PBS at 15 min; **** p < 0.0001, Chow-PBS vs. HFD-PBS at 30, 60, 90 min, ### p < 0.001, HFD-PBS vs. HFD-UTS-001 at 60, 90 min and ## p < 0.01, HFD-PBS vs. HFD-UTS-001 at 30 min. in (b) **** p < 0.0001 vs. Chow-PBS; #### p < 0.0001 vs. HFD-PBS group.

