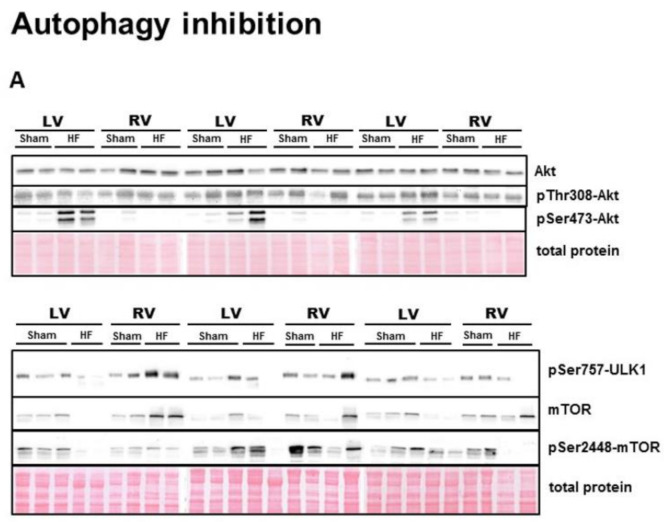
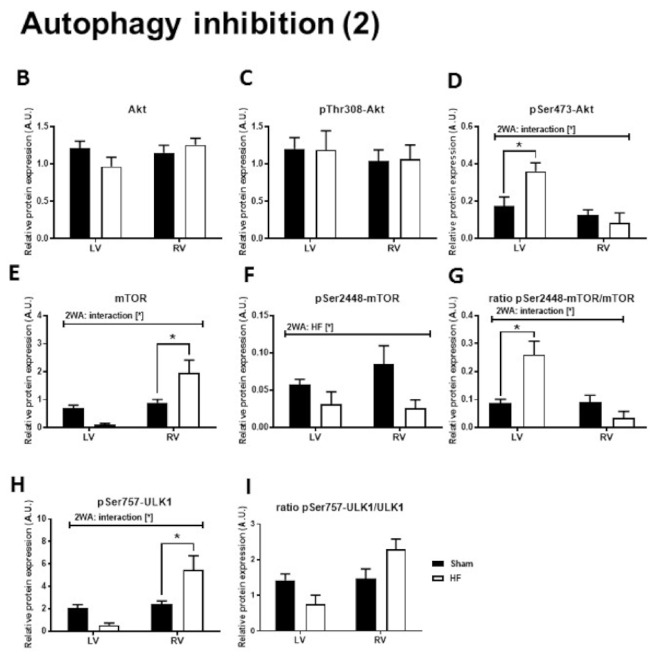
Figure 3.
Analysis of inhibition of autophagic signaling in the left and right ventricle of rat hearts. (A) representative immunoblots and total protein staining; (B–I) Immunoblot quantification of Akt, pThr308-Akt, pSer473-Akt, mTOR, pSer2448-mTOR, ratio pSer2448-mTOR/mTOR, pSer757-ULK1, ratio pSer757-ULK1/ULK1. Sham—sham-operated group; HF—group with post-myocardial infarction heart failure; LV—left ventricle; RV—right ventricle. Data are presented as mean ± SEM; n = 6–9 per group; 2WA—2-way ANOVA; “HF” factor—presence of heart failure; “V” factor—heart ventricle; “Interaction” of 2 factors. * p < 0.05 vs. Sham.


