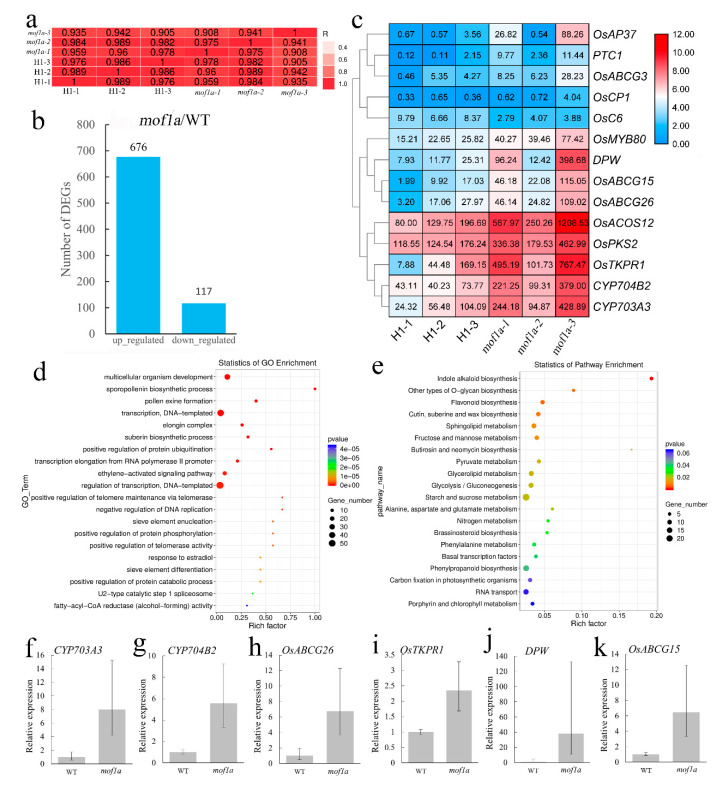
Figure 5.
RNA-seq of mof1a and WT anthers during meiosis. (a) The Pearson correlation of RNA-seq between three biological replicates of mof1a and H1. (b) Number of DEGs that were identified from mof1a. (c) Hierarchical cluster analysis of average expression level (FKPM) of 14 tapetum related DEGs. Red indicates a relatively high expression level, while blue indicates a relatively low expression level. (d) Gene ontology enrichment of DEGs in mof1a. (e) KEGG pathway enrichment of DEGs in mof1a. (f–k) Expression levels of CYP703A3 (f), CYP704B2 (g), OsABCG26 (h), OsTKPR1 (i), DPW (j), and OsABCG15 (k) in WT and mof1a anthers during microsporogenesis were analyzed using qRT-PCR. Ubiquitin gene was used as an internal control. The grey bars denote the mean expression of each gene (three independent replicates) and the error bars indicate the ±SD of three independent replicates.

