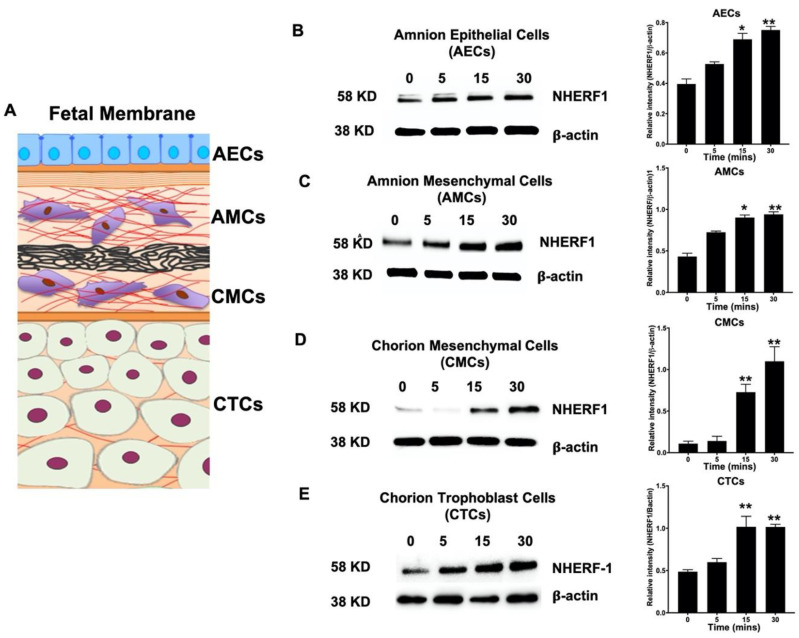
Figure 4.
Expression levels of NHERF1 in human fetal membrane primary cells induced by LPS. (A) Representation of different layers of human fetal membrane. WB analysis of (B) amnion epithelial cells (AECs), (C) amnion mesenchymal cells (AMCs), (D) chorion mesenchymal cells (CMCs), and (E) chorion trophoblast cells (CTCs) to determine the levels of NHERF1 in response to LPS at different timepoints. The relative levels of NHERF1 significantly increased in a time-dependent manner with LPS treatment compared to the control in different layer cells of fetal membrane. The blots were stripped and reprobed with β-actin as a loading control. Bar graphs show relative intensities of bands for the NHERF1 protein for respective primary cells. Representative blots from n = 3 for each cell type are shown. Data presented as mean ± SEM. Statistical significance was determined by one way ANOVA. * p < 0.05, ** p ≤ 0.01 vs. 0 min.

