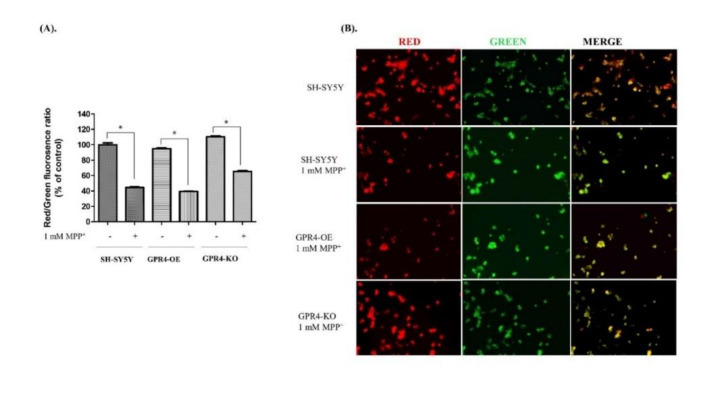
Figure 7.
The measurement of mitochondrial membrane potential (MMP) in MPP+-treated SH-SY5Y cells that were stably GPR4-OE or GPR4-GPR4-KO. 24 h serum-starved SH-SY5Y cells were treated with MPP+ (1 mM) for 24 h in serum-free culture media; a JC-10 fluorescence quantitative assay (according to the manufacturer’s instructions) and fluorescence microscopy were then employed to measure their MMP. (A) The percentage ratios of J-aggregates (red) and J-monomers (green). (B) MMP changes were monitored with a JC-10 dye that is detectable through fluorescence microscopy. Mean ± SEM (n = 3) was employed to express the data. Tukey’s multiple comparison test was performed using a one-way ANOVA. Each * p < 0.05 refers to the sample concentration compared with the same group of non-treated cells.

