
Figure 2.
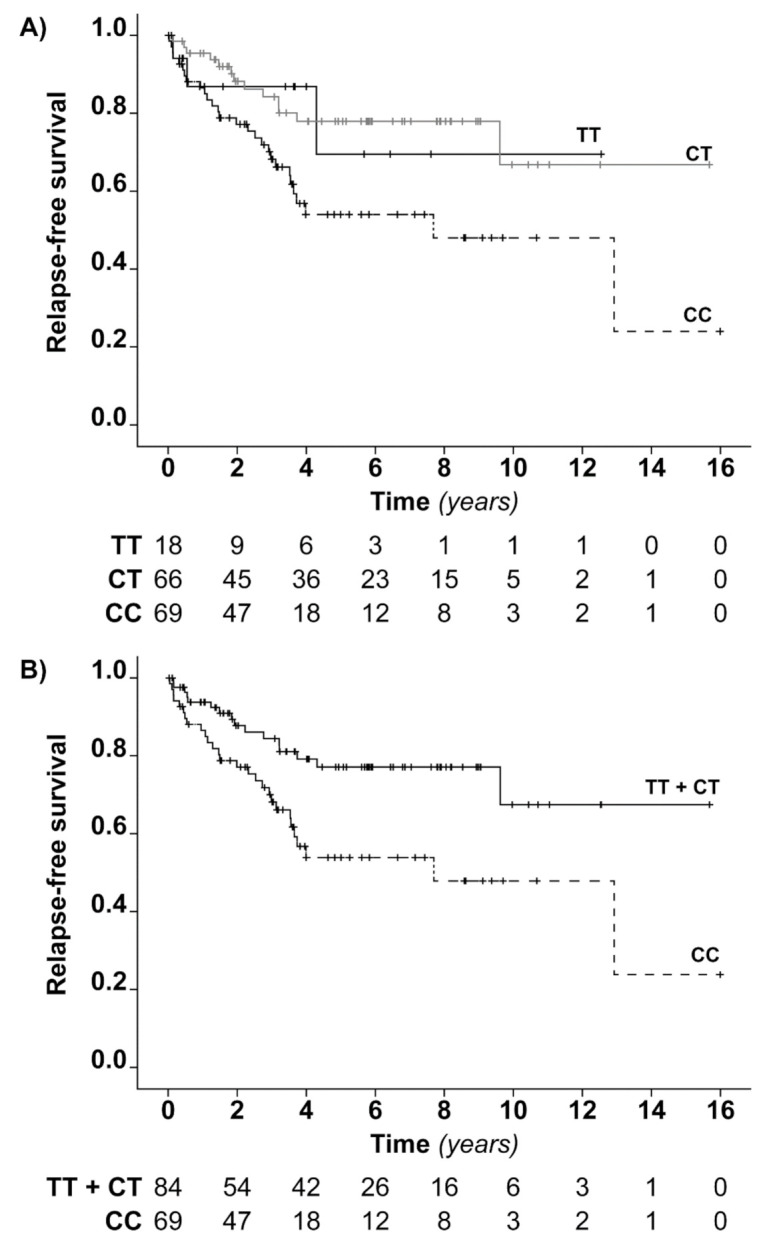
Relapse-free survival analysis in iTTP patients according to the rs6903608 genotype. (A) The Kaplan–Meier curves show the cumulative probability of being relapse-free in iTTP patients homozygous for the risk allele (CC), heterozygous (CT) and homozygous for the reference allele (TT). (B) Kaplan–Meier curves show the cumulative probability of being relapse-free in iTTP patients homozygous for the risk allele (CC) and carriers of reference allele (TT + CT). Tick-marks indicate censored subjects. Below the figures, the numbers of subjects at risk of TTP relapse at 0, 2, 4, 6, 8, 10, 12, 14 and 16 years from the remission of the first acute episode are reported.