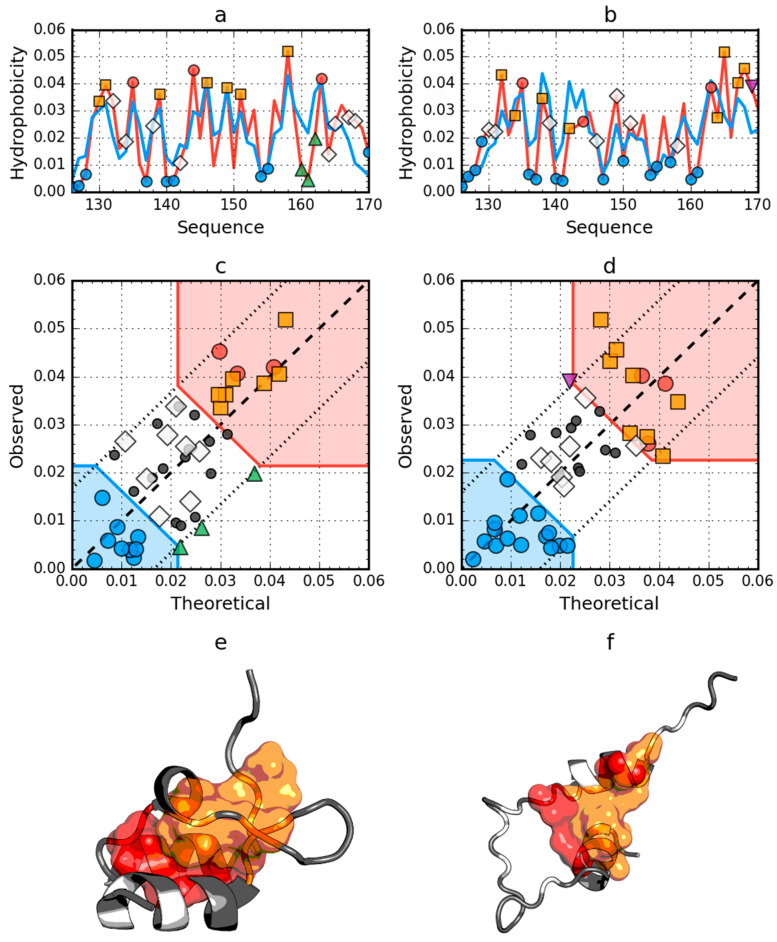
Figure 2.
Hydrophobicity density distributions and 3D presentation of native (a,c,e) and early stage (b,d,f) forms of peripheral-subunit binding domain (PDB ID: 1W4E). Blue line on (a,b): theoretical distribution (T); red line on (a,b): observed distribution (O); red zone on (c,d): hydrophobic core; blue zone on (c,d): hydrophilic surface; red circle markers: common hydrophobic core members in both models; orange square markers: hydrophobic core members in this model but not in the other model; white rhombus markers: hydrophobic core members in other model but not in this model (possible overlap with other markers); blue circle markers: hydrophilic surface members in this model; green triangle markers: T value >> O value; purple triangle markers: T value << O value: black circle markers: hydrophobically insignificant residues. Colored segments on (e,f) correspond to markers of the same color on (a–d), respectively (hydrophobic core is shown as surface).

