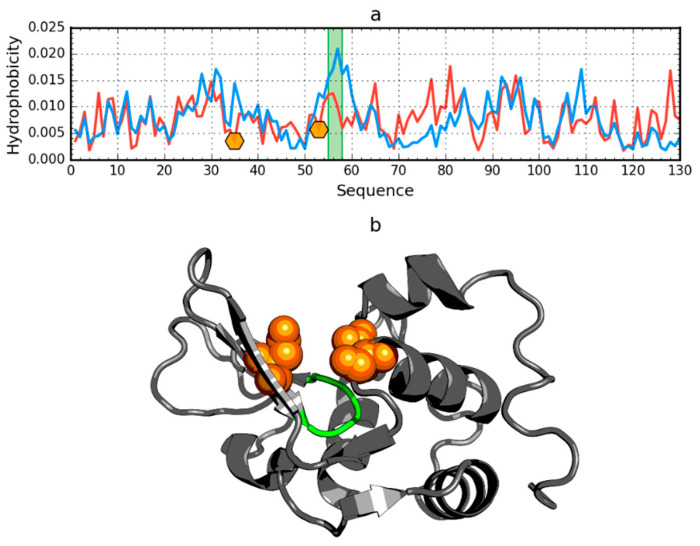
Figure 7.
Hydrophobicity density distributions (a) and 3D presentation (b) of human lysozyme (PDB ID: 1LZ1). Blue line: theoretical distribution (T); red line: observed distribution (O). Orange markers on (a) and orange spheres on (b) denote catalytic residues (E35, D53). Green segments on (a,b) span residue range 55–58.

