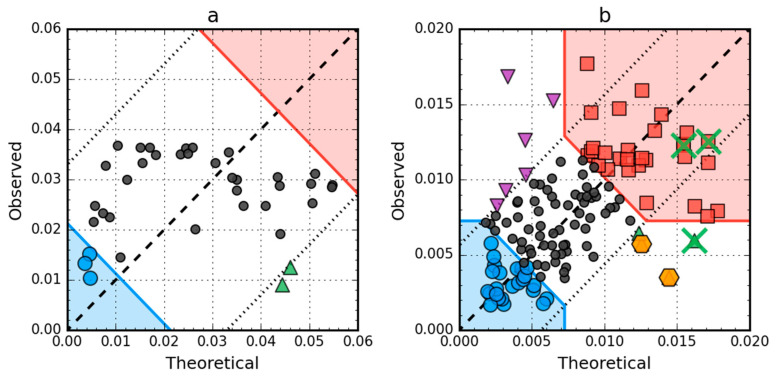
Figure 8.
Hydrophobicity density scatter plots (X-axis: T, Y-axis: O) of antifreeze protein from winter flounder (PDB ID: 1WFA) (a) and human lysozyme (PDB ID: 1LZ1) (b). Red square markers: hydrophobic core members; blue circle markers: hydrophilic surface members; green triangle markers: T value >> O value; purple triangle markers: T value << O value; black circle markers: hydrophobically insignificant residues. Red and blue backgrounds are areas in which residues are classified as belonging to either core or surface. Orange hexagonal markers on (b) denote catalytic residues (E35, D53). Green “×” markers on (b) span residue range 55–58 (F57 has been omitted for clarity; it is to the right of the X-axis limit, T = 0.209).

