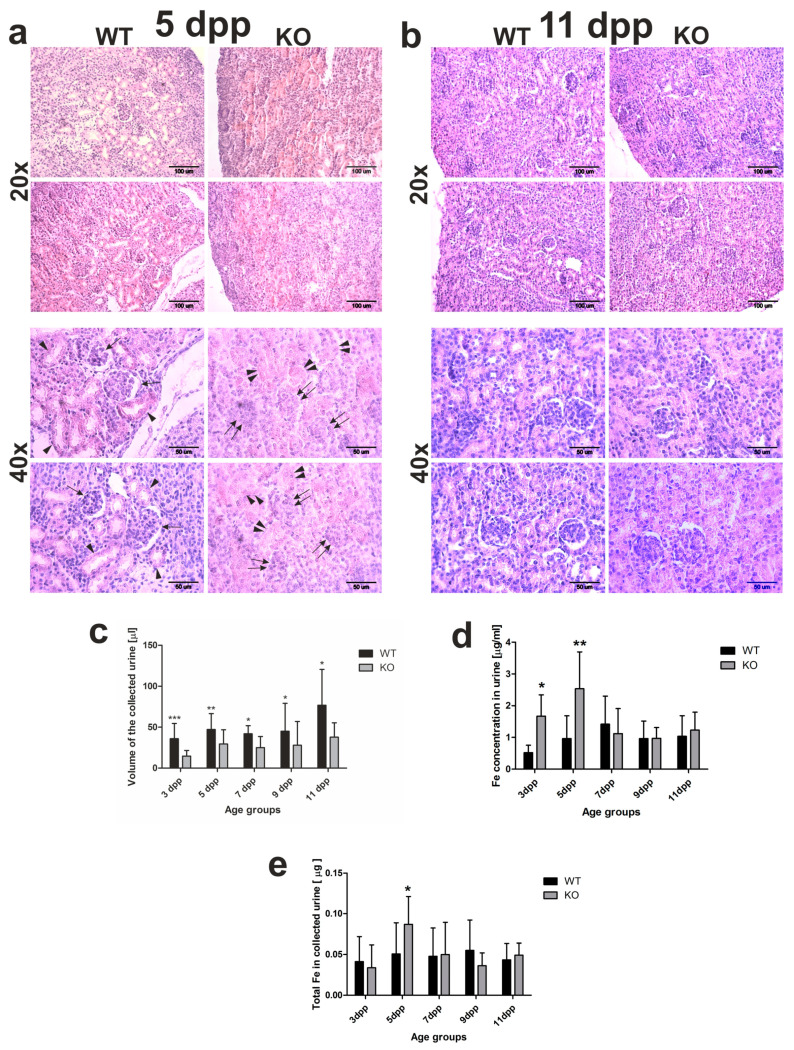
Figure 2.
Kidney structure and urine analyses. (a,b) Hematoxylin–eosin staining of kidney sections from 5 and 11 day old (WT) and heme oxygenase 1 (HO1) knockout (KO) neonates; 20× magnification (upper panels) or 40× magnification (bottom panels). Scale bars correspond to 100 µm in 20× magnification and 50 µm in 40× magnification. (c) Iron concentration measured by AAS (atomic absorption spectroscopy) in urine samples of the WT and KO neonates from all age groups: n = 6 for WT 3 dpp, n = 10 for WT 5 dpp, n = 10 for WT 7 dpp, n = 5 for WT 9 dpp, n = 6 for WT 11 dpp, n = 5 for KO 3 dpp, n = 9 for KO 5 dpp, n = 5 for KO 7 dpp, n = 5 for KO 9 dpp, and n = 5 for KO 11 dpp. To compare differences in urine iron concentration between WT and KO groups at each time point, Student t-tests were used for all datasets. (d) Urine volume collected from urinary bladder of mice after dissection: n = 16 for WT 3 dpp, n = 19 for WT 5 dpp, n = 8 for WT 7 dpp, n = 12 for WT 9 dpp, n = 14 for WT 11 dpp, n = 14 for KO 3 dpp, n = 18 for KO 5 dpp, n = 7 for KO 7 dpp, n = 9 for KO 9 dpp, and n = 9 for KO 11 dpp. To compare differences in collected urine volumes between WT and Hmox1 knockout (KO) groups at each time point, Student t-tests were used in 3 dpp, 5 dpp, 7 dpp, and 9 dpp age groups (where data distribution was normal) and a Mann–Whitney U test was used in the 11 dpp age group (where data distribution was not normal). (e) Iron content in urine collected from urinary bladder of mice after dissection: n = 10 for WT 3 dpp, n = 12 for WT 5 dpp, n = 9 for WT 7 dpp, n = 5 for WT 9 dpp, n = 6 for WT 11 dpp, n = 5 for KO 3 dpp, n = 9 for KO 5 dpp, n = 5 for KO 7 dpp, n = 5 for KO 9 dpp, and n = 5 for KO 11 dpp. To compare differences in total urine iron content between WT and Hmox1 KO groups at each time point, we used Student t-tests in all age groups. Values are expressed as the means ± SD; * p < 0.05, ** p < 0.01, *** p < 0.001. dpp—days postpartum.

