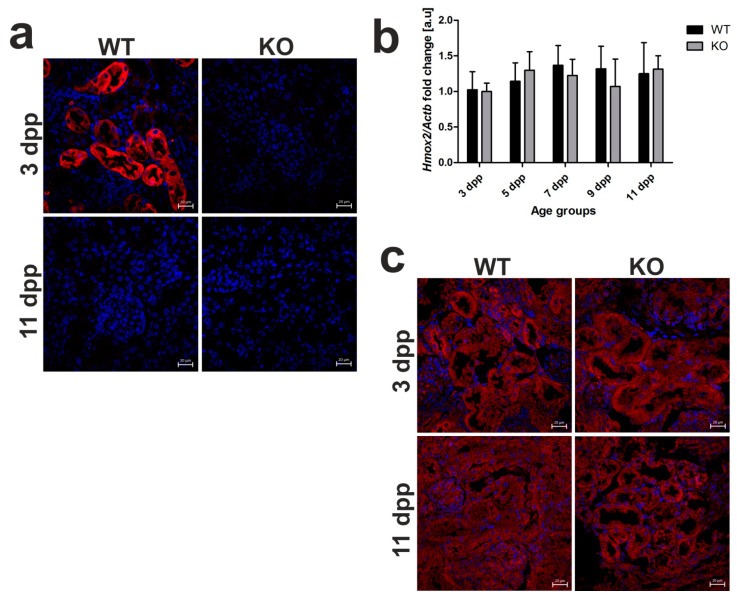
Figure 5.
Heme oxygenase 1 (HO1) and heme oxygenase 2 (HO2) expression in the kidneys of wild-type and Hmox1-deficient neonatal mice. (a) Immunofluorescence (IF) staining of HO1 (red channel) in the kidneys of 3 and 11 day old wild-type (WT) and Hmox1 knockout (KO) neonatal mice, analyzed by confocal microscopy. Cell nuclei were counterstained with DAPI (blue). Scale bars correspond to 20 μm. (b) RT-qPCR analysis of HO2 mRNA levels in the kidneys of WT and KO mouse neonates ranging from 3–11 days old. The graph presents relative HO2 transcript levels in arbitrary units (means ± SD, n = 5 per group; Student t-test, NS). (c) IF staining of HO2 (red channel) in the kidneys of 3 and 11 day old WT and KO neonatal mice, analyzed by confocal microscopy. Cell nuclei were counterstained with DAPI (blue). Scale bars correspond to 20 μm. dpp—days postpartum, NS—not significant.

