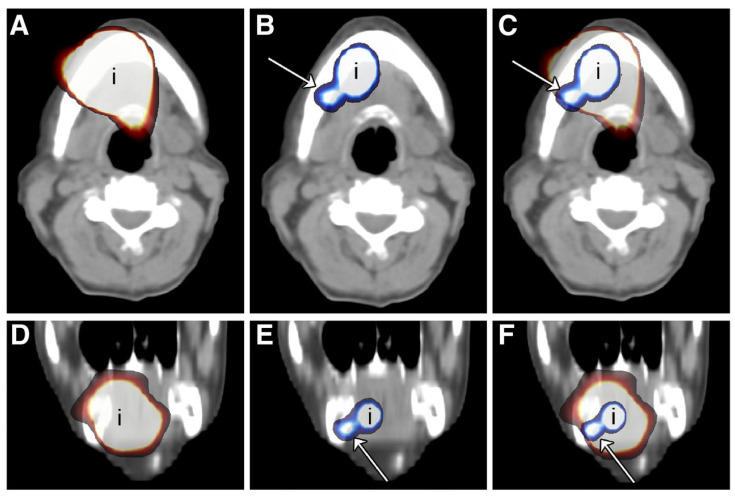
Figure 6.
(A,D) Axial (A) and coronal (D) SPECT-CT image of injection site (i) of patient 1, i.e., floor of mouth, in which only a large hot spot from injection site could be visualized. (B,E) PET-CT image of injection site of same patient in which level IB lymph node (arrow) clearly could be identified. (C,F) Fused SPECT and PET-CT images showing that lymph node visualized on PET-CT is hidden behind large hot spot on SPECT-CT images [33]. This research was originally published in JNM [33]. Figure used with permission of original authors. ©SNMMI.

