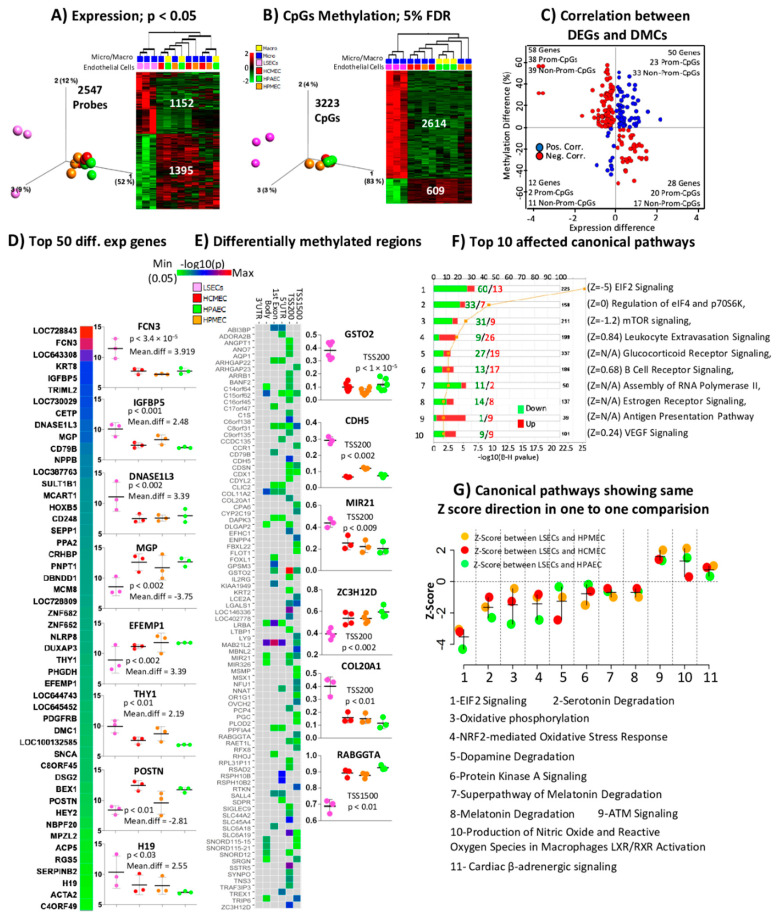
Figure 1.
Expression and CpGs methylation profiling in fetal liver sinusoidal endothelial cells (f-LSECs) and other fetal endothelial. Cells (f-ECs): Human cardiac microvascular endothelial cells (HCMEC), Human pulmonary arterial endothelial cells (HPAEC) and Human pulmonary microvascular endothelial cells (HPMEC). Three-dimonsional-PCA plot and heatmap of (A) differentially expressed genes (DEGs) (at p< 0.05) and (B) differentially methylated CpGs (DMCs) (at 5% of FDR). (C) Correlation (Pearson > 0.7) between DEGs (at p < 0.05) and CpG methylation (red and blue correspond to negative and positive correlation, respectively). (D) Heatmap of −log10(p) and mean expression difference (fold change in log2 scale) of top 50 DEGs between f-LSEC and f-EC (individual data of top eight DEGs, based on absolute mean expression difference, are shown in box plot). (E) Heatmap of all differentially methylated regions comparing f-LSECs and other f-ECs. (Individual data of best six loci are shown in box plot.) (F) Top ten affected canonical pathways enriched with DEGs compared between f-LSECs and other f-ECs with a number of upregulated and downregulated genes. (G) Selected differentially affected canonical pathways identified by IPA in comparative analysis of f-LSECs and other f-ECs. Only those displaying the same comparative directions of Z score are shown (i.e., all Z scores negative or positive in comparison to f-LSECs).

