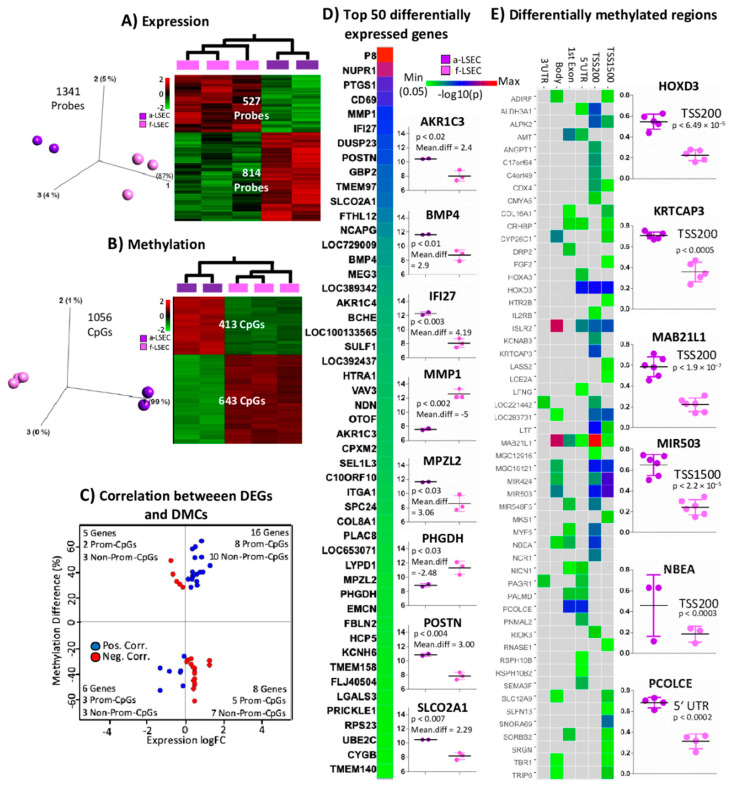
Figure 2.
Expression and CpGs methylation profiling in adult and fetal liver sinusoidal endothelial cells (a-LSECs, f-LSECs). 3D-PCA plot and heatmap of (A) Differentially expressed genes (DEGs) (at p < 0.05) and (B) Differentially methylated CpGs (DMCs) (at 5% of FDR and 0.3 projection score) between a-LSECs and f-LSECs. (C) Correlation (Pearson > 0.7) between DEGs (at p < 0.05) and CpG methylation (red and blue correspond to negative and positive correlation, respectively). (D) Heatmap of −log10(p) and mean difference (fold change in log2 scale) for top 50 DEGs between a-LSECs and f-LSECs (box plots represent the top eight significant loci based on absolute mean expression difference). (E) Heatmap of differentially methylated regions (DMRs) comparison between a-LSECs and f-LSECs with respect to different regions of a gene (i.e., TSS1500, TSS200, 5′UTR, 1stExon, body, 3′UTR) (box plots represent the six most significant markers).

