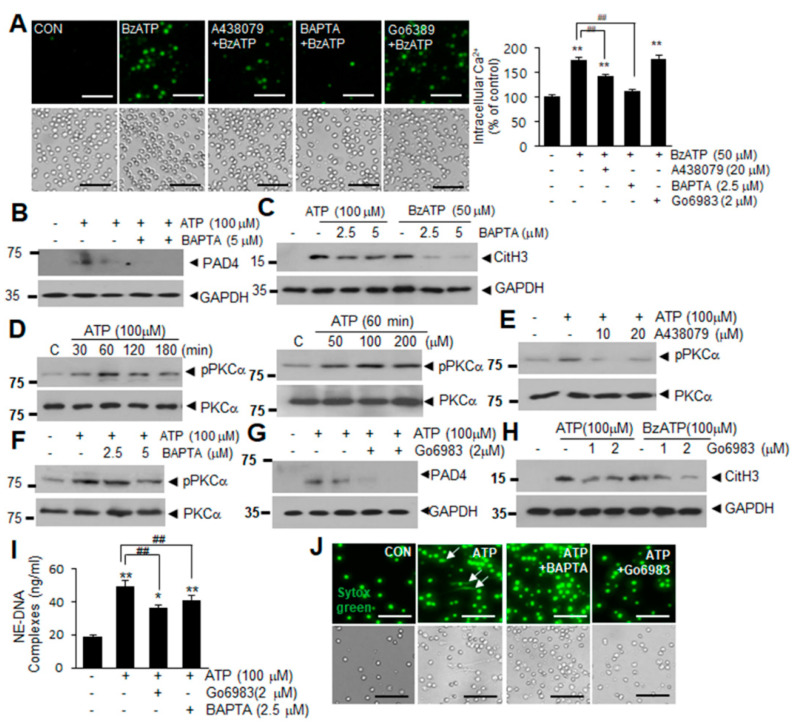
Figure 3.
Intracellular Ca2+ influx and PKCα activation in ATP-P2X7R-induced NETosis. (A) Blood PMNs were pretreated with A438079 (10 μM), BAPTA (2.5 μM), or Go6983 (1 μM) for 20 min prior to treatment with BzATP (50 μM) for 30 min. Intracellular Ca2+ levels were visualized by Fura 2-AM and quantified using ImageJ (http://rsbweb.nih.gov/ij/, accessed on 16 October 2020). Quantification of intracellular Ca2+ was normalized relative to PBS-treated controls. (B,C) Blood PMNs were pretreated with BAPTA (2.5 or 5.0 μM) for 20 min prior to treatment with ATP (100 μM) or BzATP (50 μM) for 4 h. Levels of PAD4 (B) or CitH3 (C) were subsequently determined by immunoblotting. (D) Blood PMNs were treated with ATP (100 μM) for the indicated duration or with 50, 100, or 200 μM of ATP for 30 and levels of PKCα and phospho-PKCα were examined by immunoblotting. (E,F) Blood PMNs were pretreated with A438079 (10 or 20 μM) or with BAPTA (2.5 or 5 μM) for 20 min prior to treatment with ATP (100 μM) for 30 min, then the levels of PKCα and phospho-PKCα were subsequently determined by immunoblotting. (G,H) Blood PMNs were pretreated with Go6983 (1 or 2 μM) for 20 min prior to treatment with ATP (100 μM) or BzATP (100 μM) for 4 h, then PAD4 or CitH3 levels were subsequently determined by immunoblotting. Immunoblots are representative of 2~4 independent experiments. (I,J) Blood PMNs were pretreated with BAPTA (2.5 μM) or Go6983 (2 μM) for 20 min prior to treatment with 100 μM of ATP for 12 h, with amounts of extracellular DNA complexed with neutrophil elastase (NE-DNA) subsequently assessed using Quant-iT PicoGreen dsDNA assay kit (I) and visualized using Sytox Green (J). Arrows in j indicate the released DNA and scale bars represent 50 μm. Results are presented as mean ± SEM (n = 3). ** p < 0.01, * p < 0.05 versus the PBS-treated control, ## p < 0.01 between indicated group.

