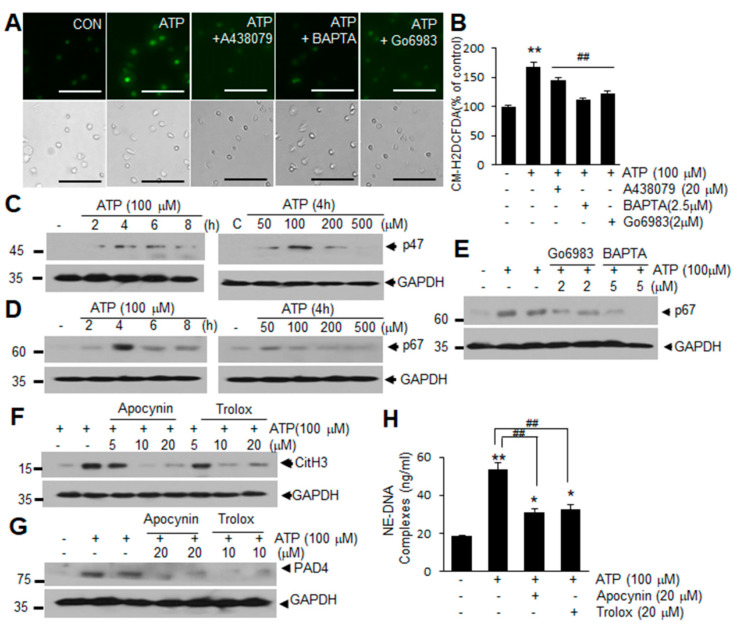
Figure 4.
Upregulation of ROS production via P2X7R in ATP-induced NETosis in blood PMNs. (A,B) Blood PMNs were pretreated with A438079 (10 μM), BAPATA (2.5 μM), or Go6983 (1 μM) for 20 min prior to treatment with ATP (100 μM) for 2 h. Intracellular ROS generation was visualized using CM-H2DCFDA and analyzed using ImageJ (http://rsbweb.nih.gov/ij/, accessed on 16 October 2020). (C,D) Levels of p47 or p67 in blood PMNs were determined after 2, 4, 6, or 8 h of treatment with ATP (100 μM), or after 4 h of treatment with a range of concentrations of ATP. (E) Blood PMNs were pretreated with BAPATA (2 or 5 μM) or Go6983 (2 or 5 μM) for 20 min prior to treatment with ATP (100 μM) for 4 h, with p67 level were subsequently assessed by immunoblotting. (F,G) Blood PMNs were pretreated with 5, 10, or 20 μM of apocynin or Trolox for 20 min prior to treatment with ATP (100 μM) for 4 h, with CitH3 (F) and PAD4 (G) levels were subsequently assessed by immunoblotting. Immunoblots are representative of 2~4 independent experiments. (H) Blood PMNs were pretreated with 20 μM of apocynin or Trolox for 20 min prior to treatment with ATP (100 μM) for 12 h, with the amounts of extracellular DNA complexed with neutrophil elastase (NE-DNA) subsequently assessed using Quant-iT PicoGreen dsDNA assay kit. Scale bars in A represent 50 μm. Results are presented as mean ± SEM (n = 3). ** p < 0.01, * p < 0.05 versus the PBS-treated controls, ## p < 0.01 versus ATP only-treated cells.

