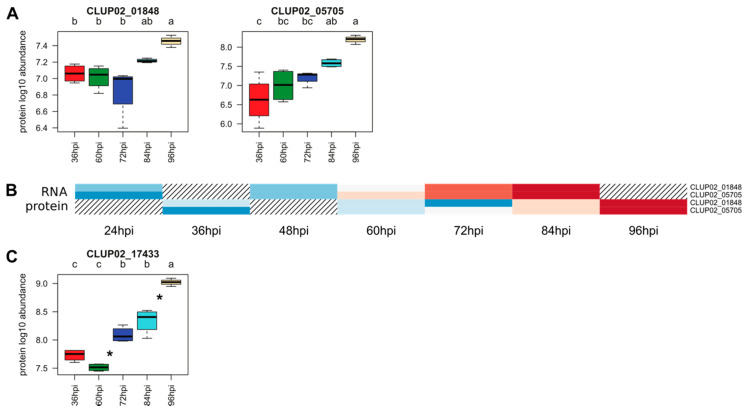
Figure 8.
Overview of C. lupini expression and synthesis of genes and proteins associated with secondary metabolism and transcription factors. Boxplots showing the mean abundance of proteins associated with secondary metabolism from four biological repetitions and quantified by mass spectrometry. (A). Heatmap of the two proteins associated with secondary metabolism regarding their abundance and the corresponding transcript expression profile. Hatching areas indicate that data are not available (B). Boxplots showing the mean abundance of the transcription factor from four biological repetitions quantified by mass spectrometry. (C). Colored bars indicated gene expression by Z-score calculated from normalized reads, and ranging from −2 (downregulated gene, blue) to 2 (upregulated gene, red), or protein abundance by Z-score calculated from protein log10 abundance, and ranging from −2 (lowest abundance, blue) to 2 (highest abundance, red). Asterisks between histograms indicate significant changes over time.

