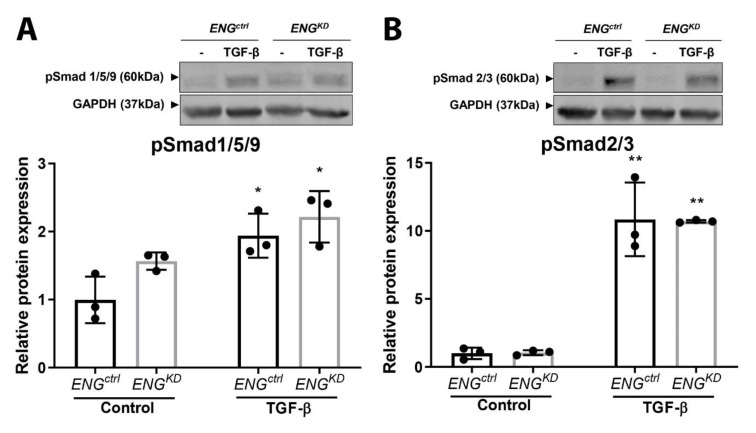
Figure 7.
TGF-β-induced Smad1/5/9 and Smad2/3 phosphorylation is similar in ENGKD and ENGctrl fibroblasts. ENGctrl and ENGKD fibroblasts were incubated with 5 ng/mL TGF-β1 for 1 h, after which pSmad1/5/9 (A) and pSmad2/3 (B) were measured using western blot analysis. GAPDH was used as a loading control. The lower graphs show the quantification of the western blot data. pSmad protein levels were plotted relative to unstimulated ENGctrl fibroblasts, and summary data are presented as the mean ± SD from three experiments. * p < 0.05 and ** p < 0.01 versus unstimulated fibroblasts from the same cell line. (Student’s t-test).

