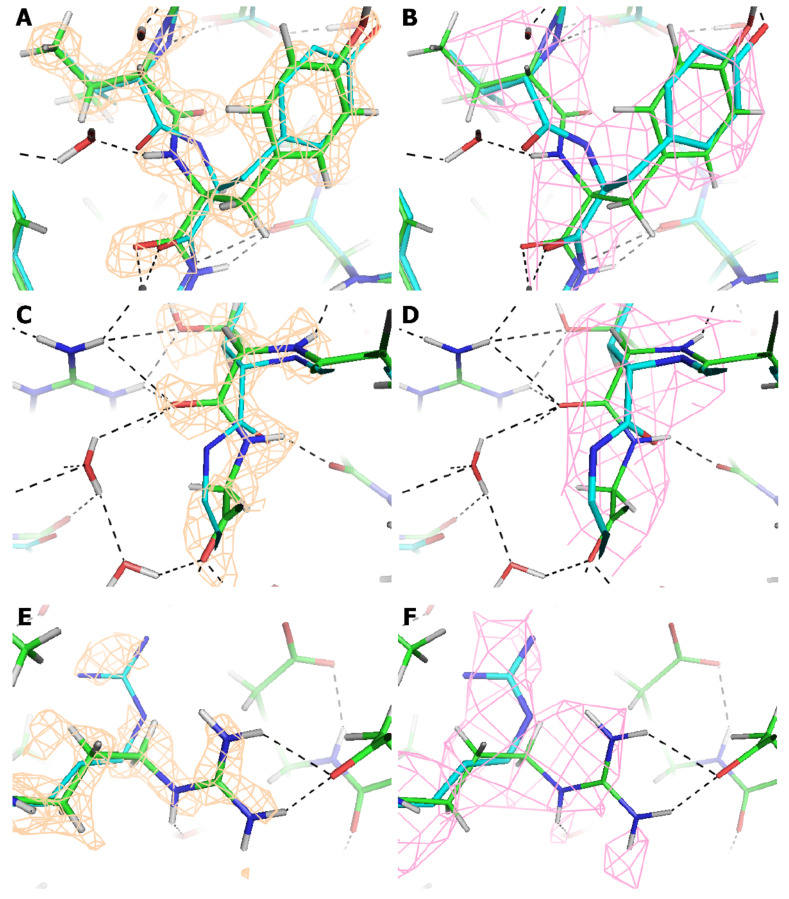
Figure 4.
Improvements in the structure between 2.8 Å and 1.56 Å resolution. Paired images show the 1.56 Å (brown, left) and 2.8 Å (pink, right) reconstructions with the refined atomic models with green Cα (1.56 Å) or cyan (2.8 Å). (A,B) Peptide bond Val613-Tyr614, both maps contoured at 2.0 σ. (C,D) Peptide at the tight turn Thr407-Gly408, both maps contoured at 1.5 σ. (E,F) Side chain of Arg391, both maps contoured at 1.1 σ.

