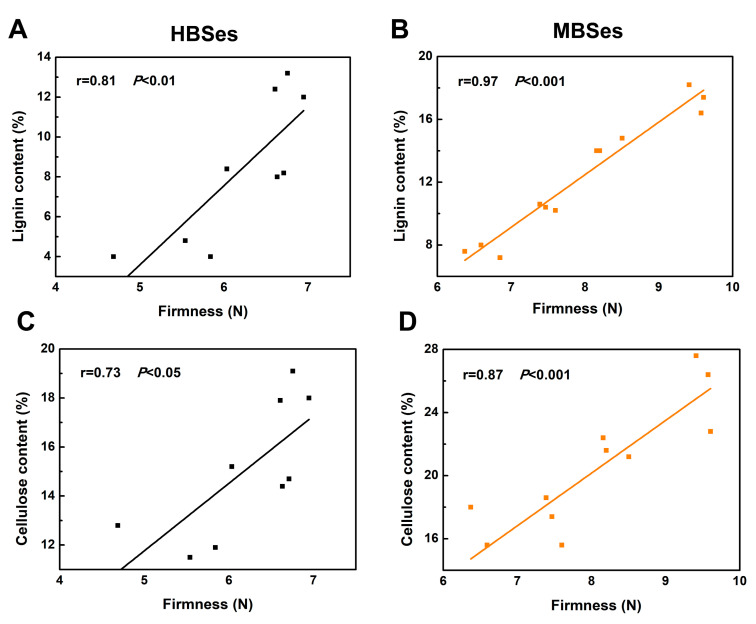
Figure 3.
Scatterplots between firmness and lignin and cellulose contents in HBSes and MBSes at room temperature. (A) Linear regression analysis between firmness and the lignin content in HBSes. (B) Linear regression analysis between firmness and the lignin content in MBSes. (C) Linear regression analysis between firmness and the cellulose content in HBSes. (D) Linear regression analysis between firmness and the cellulose content in MBSes. Significant differences were determined using SPSS Statistics 20.0.

