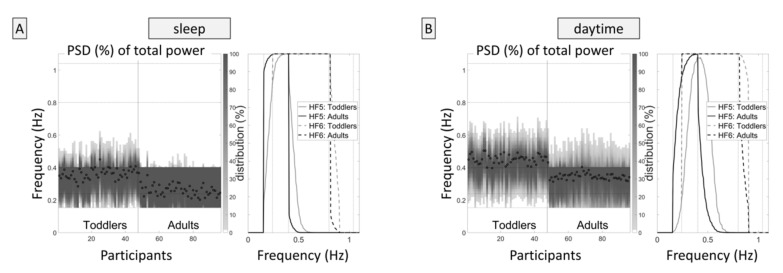
Figure 1.
Dynamically adjusted frequency bands. The figure on the left side shows the distribution of the frequency ranges for each participant during sleep. (A), each column represents one participant. The shade of the columns represents the percentage of the power spectral density (PSD) in the respective frequency (percentage of the respective participant’s total power). The dots represent the respiration frequency of each participant (the arithmetic mean of all dots for toddlers equals the value given in Table 1, i.e., 0.36 Hz or 21.7 min−1). (B) shows the percentages of participants in whom variability in the respective frequencies was continuously present, that is, in all 180 s segments over the entire recording period, displayed for HF5 and HF6. The figure illustrates how well (or poorly) the frequency bands captured the actual heart rate variability in adults and toddlers: In the majority of adults, but not in toddlers, the dominant frequencies are in the recommended frequency range for short-term heart rate variability (HRV, 0.15–0.40 Hz). The right figure shows the dynamic frequency band adaptation for the day.

