Figure 2.
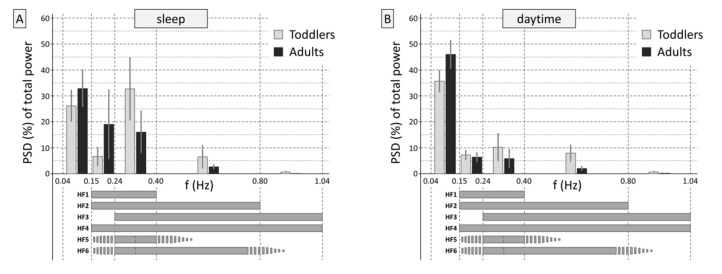
Prevalent frequency ranges (frequency domain). (A) shows the proportions of normalized high-frequency (HF) power in the frequency ranges of interest, which were averaged across participants and expressed as percentages of the total heart rate (HR) variability. Adding up the depicted values to HF1 (0.15–0.40 Hz, i.e., 2nd + 3rd column, see schematic bars below parts (A,B), HF2 (0.15–0.80 Hz), HF3 (0.24–1.04 Hz), and HF4 (0.15–1.04 Hz) provides an impression of the power spectral density estimates for these frequency bands, independently from the RRI level. Furthermore, the proportion of long-term variability can be seen in the low-frequency range (0.04–0.15 Hz). During sleep, the difference in the dominant HF frequency band between toddlers and adults—in toddlers 0.24–0.40 Hz—can be seen clearly. (B) shows the normalized HF power during the day, and (C,D) displays the separate analyses for periods with low and high levels of activity during the day.


