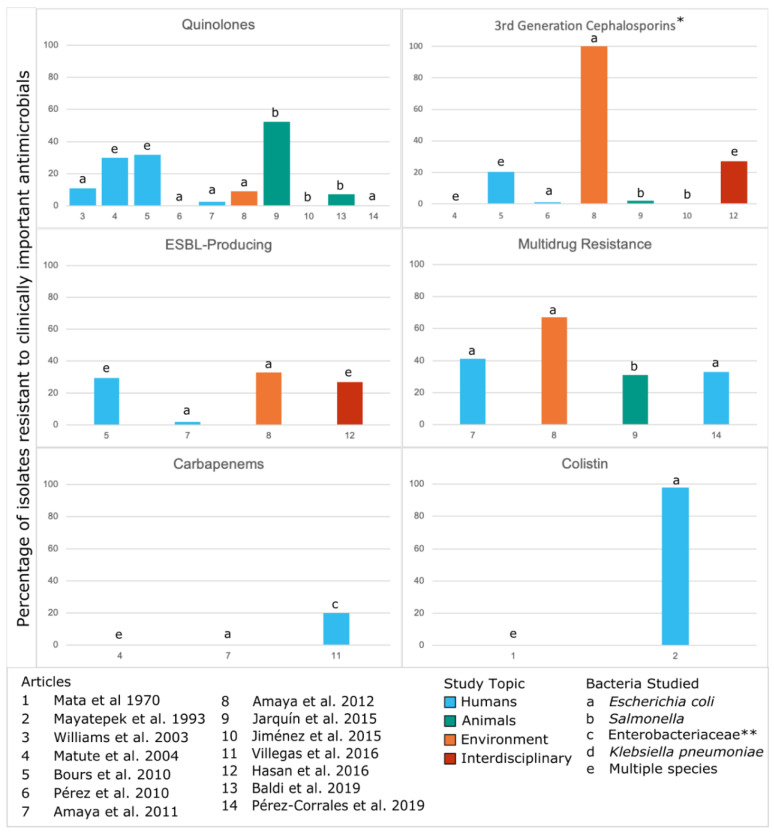
Figure 3.
Phenotypic resistance to clinically important antimicrobials from the included studies on CA-ARE in Central America.Numbers in the x-axis correspond to the articles listed. Resistance rates are only shown for the most prevalent species as indicated in the Measure column of Table 1 though some studies tested multiple species for resistance. This figure excludes three of the articles that did not report percentages or prevalence: Liebana et al. 2004 [37] and Pasteran et al. 2012 [38] (case reports), and Pehrsson et al. 2016 [46] (resistomes). Three articles that did not study resistance to clinically important antimicrobials were also excluded from this figure: Shears et al. 1988 [32], Rodríguez et al. 2006 [43], Molina et al. 2016 [41]. In the above figure, * represents potential ESBL producers but not all studies tested for ESBL production; ** indicates that the bacterial species studied were not specifically defined beyond the family Enterobacteriaceae.

