Figure 5.
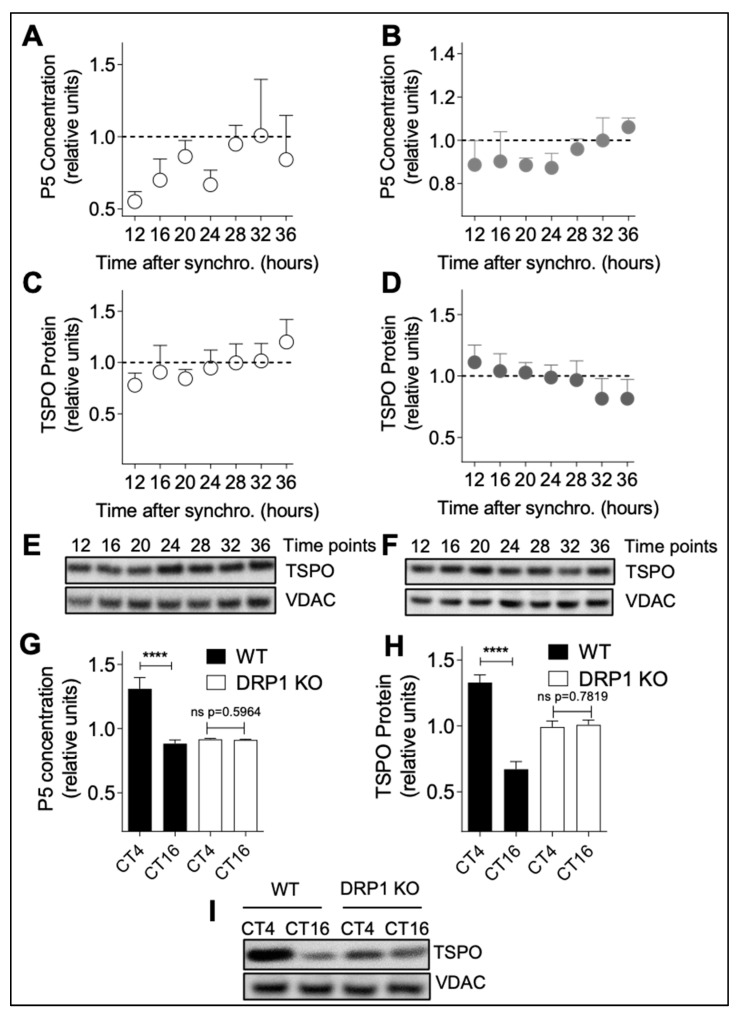
Disrupted mitochondrial dynamics abolish circadian variations of pregnenolone and TSPO. (A) P5 concentration was measured in lysates from synchronized A172 glioma cells chronically treated with 5 μM MDIVI-1. Time points from 12 to 36 h post-synchronization are shown. All data are normalized to 1 and presented as mean ± SD (two independent experiments, seven time points, n = 4–8 for each time point). (B) P5 concentration was measured in lysates from synchronized mitofusion 2 (MFN2) siRNA transfected A172 glioma cells. Time points from 12 to 36 h post-synchronization are shown. All data are normalized to 1 and presented as mean ± SD (two experiment, seven time points, n = 4–5 for each time point). (C) TSPO protein levels were analyzed by immunoblotting in lysates from synchronized A172 glioma cells chronically treated with 5 μM MDIVI-1. Time points from 12 to 36 h post-synchronization are shown. All data are normalized to 1 and presented as mean ± SD (two independent experiments, seven time points, n = 6–8 for each time point). (D) TSPO protein expression was analyzed by immunoblotting in lysates from synchronized A172 glioma cells transfected with MFN2 siRNA. Time points from 12 to 36 h post-synchronization are shown. All data are normalized to 1 and presented as mean ± SD (two experiments, seven time points, n = 3–6 for each time point). (E,F) Representative immunoblots of lysates from synchronized MDIVI-1 treated A172 glioma cells (E) and MFN2 siRNA transfected cells (F) stained with antibodies specific for TSPO and VDAC (control). Time points from 12 to 36 h post-synchronization are shown. (G,H) Rhythmic changes in P5 levels (G) and TSPO protein expression (H) are abolished in DRP1 knock-out mice. TSPO levels at peak and trough corresponding to CT4 and CT16 from brain homogenates of wild-type mice compared to DRP1 knock-out (DRP1 KO) mice. All data are normalized to 1 and presented as mean ± SEM (WT and DRP1 KO: two time points, nWT = 5 and nDRP1 KO = 9 for each time point). **** p < 0.0001 (unpaired Student’s t-test). (I) Representative immunoblots of brain lysates from wild-type (WT) and Drp1 knockout (DRP1 KO) mice stained with antibodies specific for TSPO and VDAC (control). Time points CT4 and CT16 are shown.

