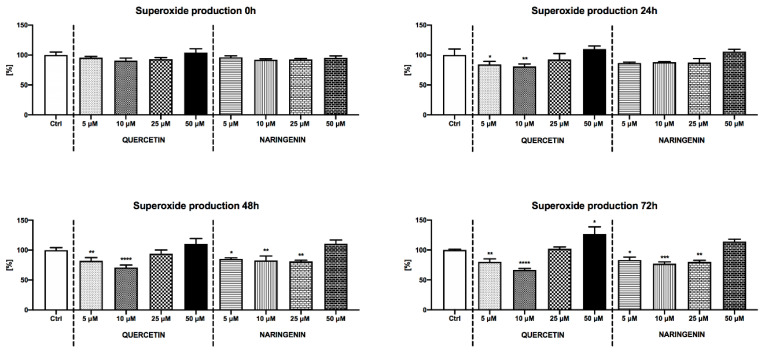
Figure 2.
Intracellular superoxide production of boar spermatozoa extended in the presence of quercetin or naringenin. Each bar represents mean (± S.D.) optical density as the percentage of the control, which was set to 100% and the data are expressed as a% of the control value. The data were obtained from four independent experiments. Mean ± S.D. * p < 0.05; ** p < 0.01; *** p < 0.001; **** p < 0.0001.

