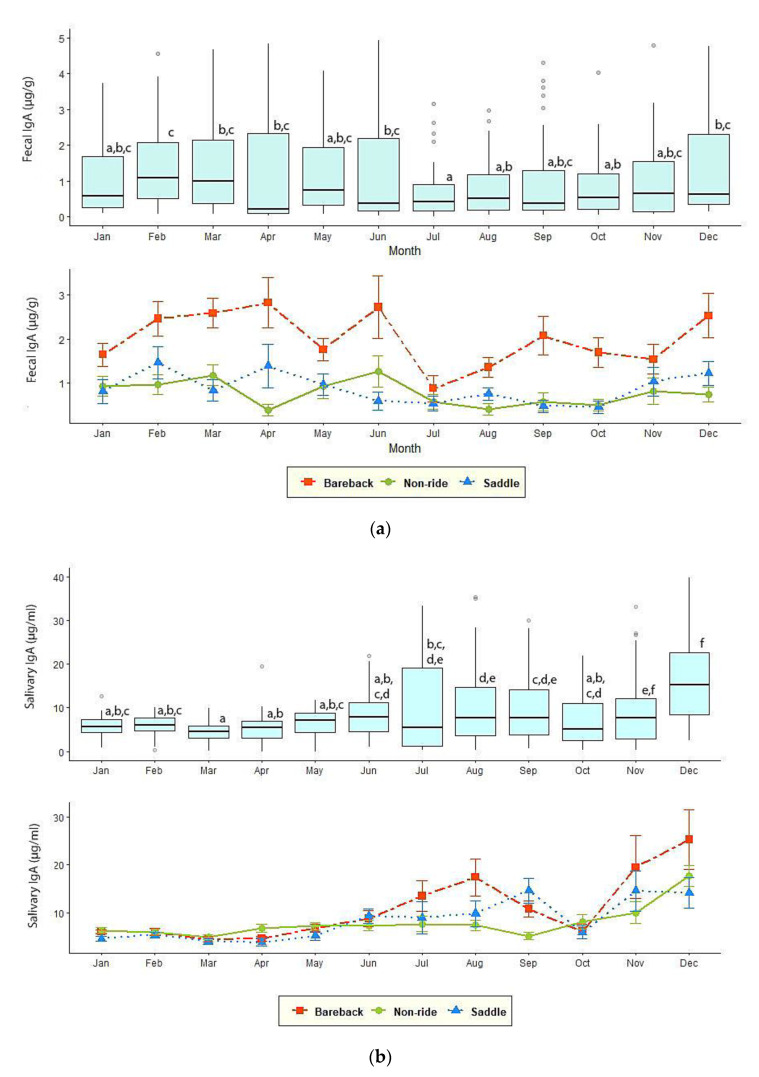
Figure 2.
Mean (±SEM) of (a) fecal (µg/g) and (b) salivary (µg/mL) IgA concentrations in each elephant activity group. Box plot showed overall fecal and salivary IgA measures in combination with three elephant groups (N = 44). Whiskers represent median, quartiles, and the 25th/75th percentiles, error bars represent the 10th/90th percentiles, and open circles indicate outliers. Different superscripts indicate a significant difference at p < 0.05.

