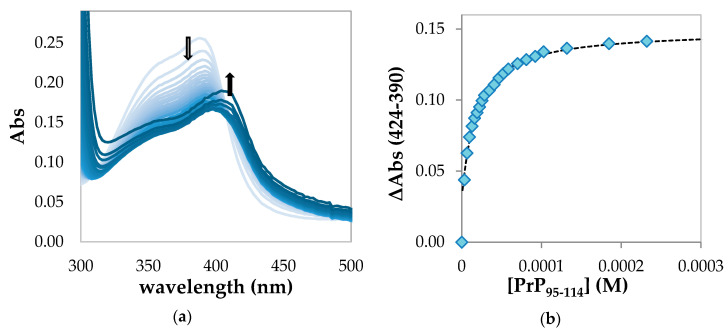
Figure 2.
(a) UV–Vis spectrophotometric titration in 20 mM phosphate buffer solution, pH 7.4, showing the decrease in intensity of the Soret band upon binding of hemin (3.25 µM) with PrP95–114 (from 0 to 90 equiv., light blue to blue) in a cell of 1 cm path length. The arrow pointing down at 390 nm indicates the hypochromic effect due to the formation of a high-spin hemin-PrP complex; the arrow pointing up at 416 nm indicates the incipient formation of a low-spin complex; (b) absorbance changes with respect to free hemin at 424 nm with subtraction of the contribution at 390 nm vs. PrP95–114 concentration fitted by high-affinity equation described in the Materials and Methods section.

