Figure 3.
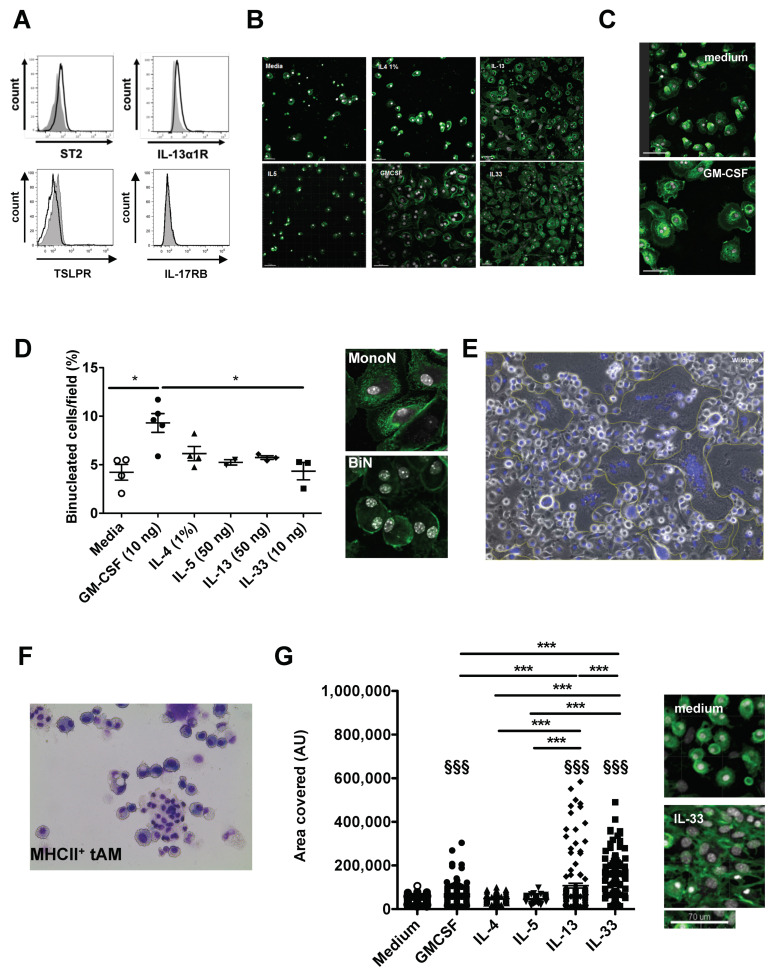
Tissue resident macrophages undergo binucleation upon GM-CSF treatment in vitro. (A) Resident tAMs express a receptor for IL-33 (ST2) and IL-13 (IL-13Ra), but not for IL-25 (IL-17RB) and TSLP as shown by flow cytometry. Histograms show signal (black line) compared to Fluorescence minus one (FMO) controls (grey histogram). Data are representative of at least two independent stainings. (B) Visual examination of cultures of sorted Siglec F+ CD11c+ tAMs after 7 days of culture with medium alone, IL-4 (1%), IL-13 (50 ng/mL), IL-5 (50 ng/mL), IL-33 (50 ng/mL) or GM-CSF (10 ng/mL). Slides were stained with FITC-wheat germ agglutinin (green) and counterstained with DAPI (white). Data are representative of at least three independent experiments. Pictures were taken using a ×20 oil-immersion objective. (C) Close-up view of cells cultivated in medium alone or upon GM-CSF. Cells stimulated with GM-CSF exhibited dendrites and better adherence compared to cells in medium alone. Pictures were taken using a ×40 objective. (D) Evaluation of the frequency of polynucleated macrophages upon various stimulii. Data are mean value ± SEM; n = 2–5. Pictures show a representative example of mono and binucleated cells observed with a 40× objective, * p < 0.05. (E) BM-derived macrophage fusion induced by the presence of 1% IL-4 conditioned medium in the cell culture medium. Cells were stained with Hemacolor and the picture was taken in bright field microscopy using a ×20 objective. Data are representative of two experiments. (F) CD11c+SiglecF+ MHCII+ resident tAMs from IL-33-triggered asthmatic lungs show cells with four to six nuclei after sorting, cytospinning and staining with diff-quick reagent. Data shown are representative of at least three independent experiments. Pictures were taken using a ×20 objective. (G) Area covered by the nuclei of tAMs cultured 7 days with the above-mentioned cytokines and growth factor (media change with cytokines at day 2, 3 and 5). The areas were measured after staining and microscopic evaluation, using Image J software. Pictures show a representative example of medium-treated and IL-33-treated cells using a 40× objective. Data are mean values ± SEM. Statistical significance was assessed using ANOVA. Asterisk refers to significance between the treatments, while § refers to significance compared to the medium control; §§§ and *** p < 0.001.

