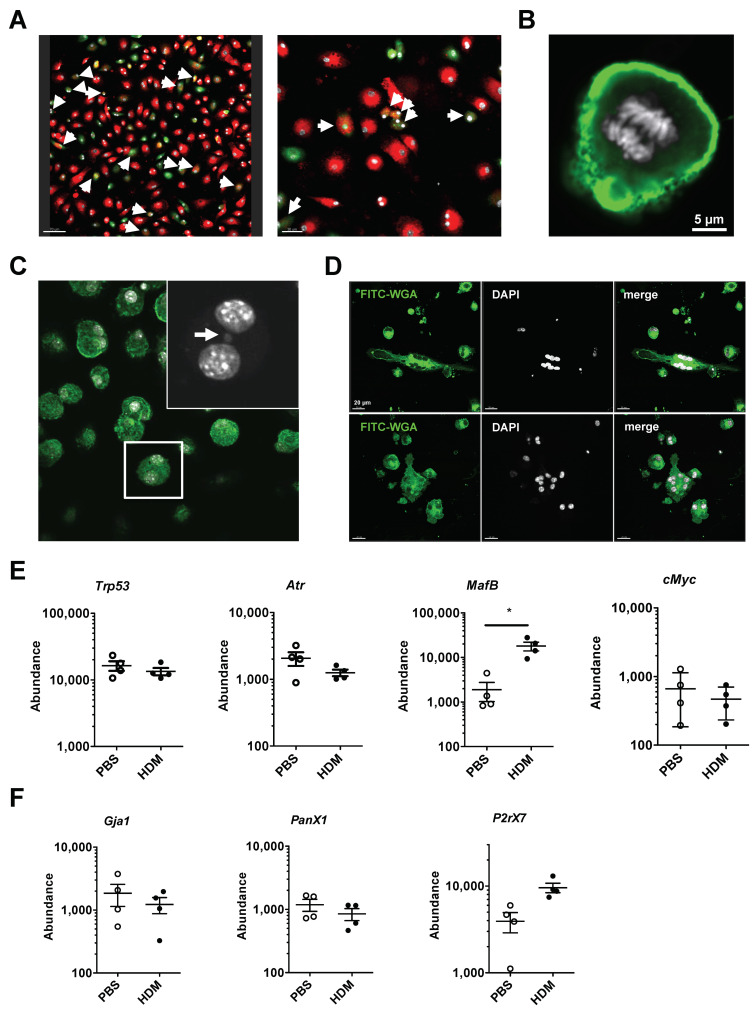
Figure 4.
tAM polynucleation arise from division defect rather than cell fusion. (A) Assessment of fused macrophages by confocal microscopy (original magnification ×20/×40). Cell fusion was assayed by cultivating for 5 days with sorted SiglecF+ CD11c+ tAMs stained with PKH26 (red) or CFSE (green) and counterstained with DAPI (white). Bars represent 70/30 μm. Arrows show cells positive for both red and green staining. (B) SiglecF+ CD11c+ tAMs cultivated with GM-CSF show signs of proliferation. Cells were stained with FITC-WGA (green), counterstained with DAPI (white) and examined by fluorescence microscopy (original magnification ×60). (C) Evidences of division defect of tAMs by confocal microscopy (original magnification ×40). tAM cultivated with GM-CSF shows the presence of micronucleus (shown by an arrow). Cells were stained with FITC-WGA (green) and counterstained with DAPI (white). (D) tAMs sorted from four-steps HDM-triggered asthmatic lungs were kept for 24 h in presence of GM-CSF. Cells show symmetrical polynucleation. Cells were stained with FITC-WGA (green) and counterstained with DAPI (white). Data are representative of two independent experiments. Picture were taken using a ×40 objective. (E) Cells from PBS or HDM treated mice for 4 weeks were isolated and analyzed for RNA content. Data show abundance of Trp53, Atr, C-myc, and Mafb mRNA reported to S14 level, in SiglecF+ CD11c+ MHCII+ tAMs. Values shown are the mean ± SEM from n = 4 isolations. Statistical significance was assessed using a t-test. * p < 0.05. (F) Expression level of Gja1, P2rx7, and Panx1 in the same samples were evaluated. Data show abundance of mRNA reported to S14 level, in MHCII+ tAMs. Values are the mean ± SEM from n = 4 isolations.

