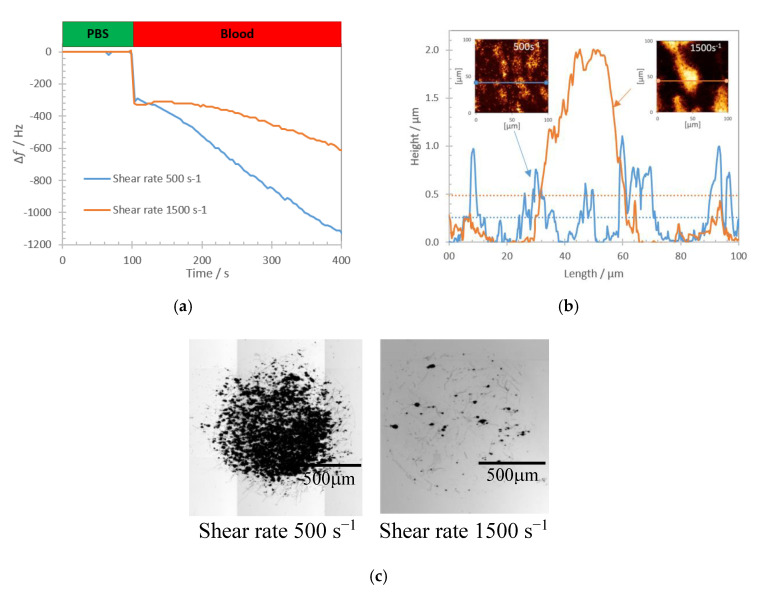
Figure 7.
(a) Real-time recorded frequency shift during 5 min of whole blood perfusion at wall shear rates 500 s−1 and 1500 s−1. (b) Height profile of platelet deposits across the biointerface for shear rates 500 s−1 (blue curve) and 1500 s−1 (orange curve) (average height for 500 s−1 (blue) and 1500 s−1 (orange) are shown with dotted lines). Insets: AFM images (height trace) of platelet deposits obtained at 500 s−1 (on the left) and 1500 s−1 (on the right) shear rates respectively. (c) Optical microscopy image of platelets deposits on collagen biointerface at 500 s−1 (on the left) and 1500 s−1 (on the right).

