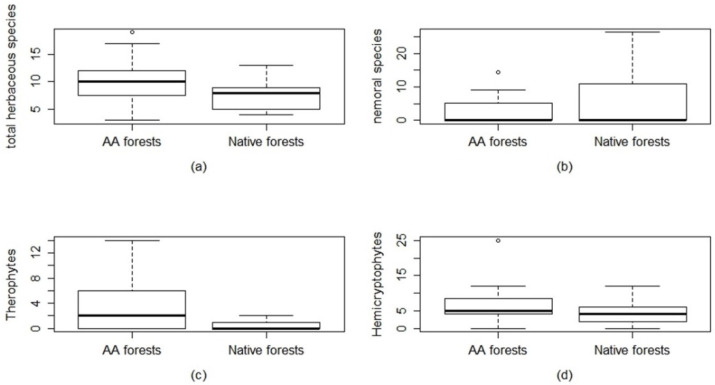
Figure 2.
Comparison of the herbaceous layer diversity and life forms between A. altissima (AA forests) and Native forests. (a) total herbaceous species diversity (p value = 0.05 *), (b) nemoral species diversity (p value = 0.065), (c) therophyte species (p value = 0.006 **), (d) hemicryptophyte species (p value = 0.085). p level: *** p < 0.001; ** p < 0.01; * p ≤ 0.05. Significant values are in bold.

