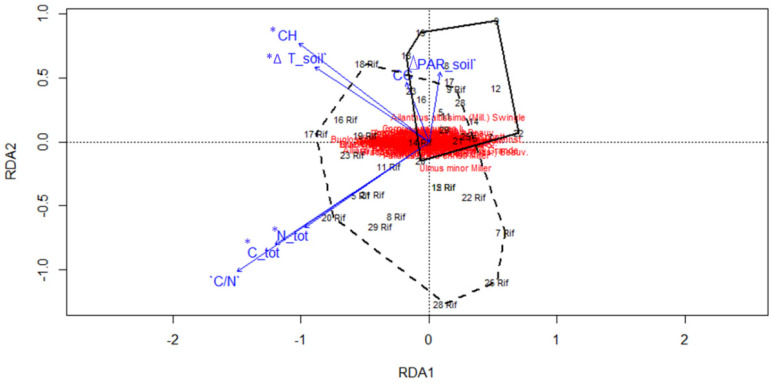
Figure 4.
RDA Ordination diagram of vegetation plots and species in relation to the considered environmental variables. A. altissima forests are within the dashed line. Native forests are within the continuous line. Significant variables (at p value ≤ 0.05) are reported with asterisks. RDA1 explains 39.1% of the cumulative amount of variance expressed as proportions of the total explained variance and RDA2 axes as 19.02%. For abbreviations of the variables, see Table 3.

