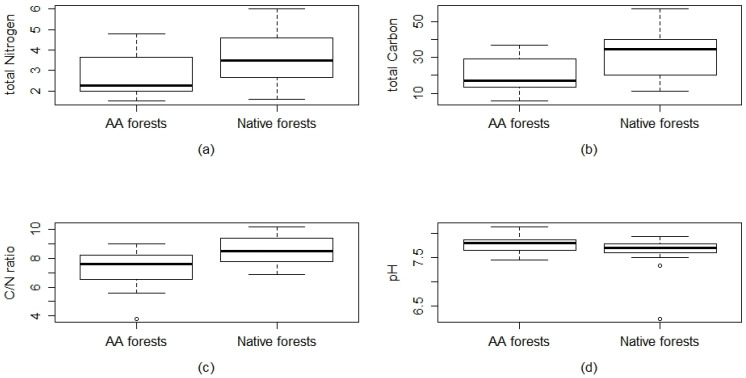
Figure 5.
Comparison of the soil chemical parameters measured for the A. altissima and native forests through box plots. (a) Total nitrogen, p value = 0.025 *; (b) Total carbon, p value = 0.007 **; (c) carbon/nitrogen ratio, p value= 0.003 **; (d) reaction expressed in pH in H2O, p value = 0.1. p level: *** p < 0.001; ** p < 0.01; * p ≤ 0.05. Significant values are in bold.

