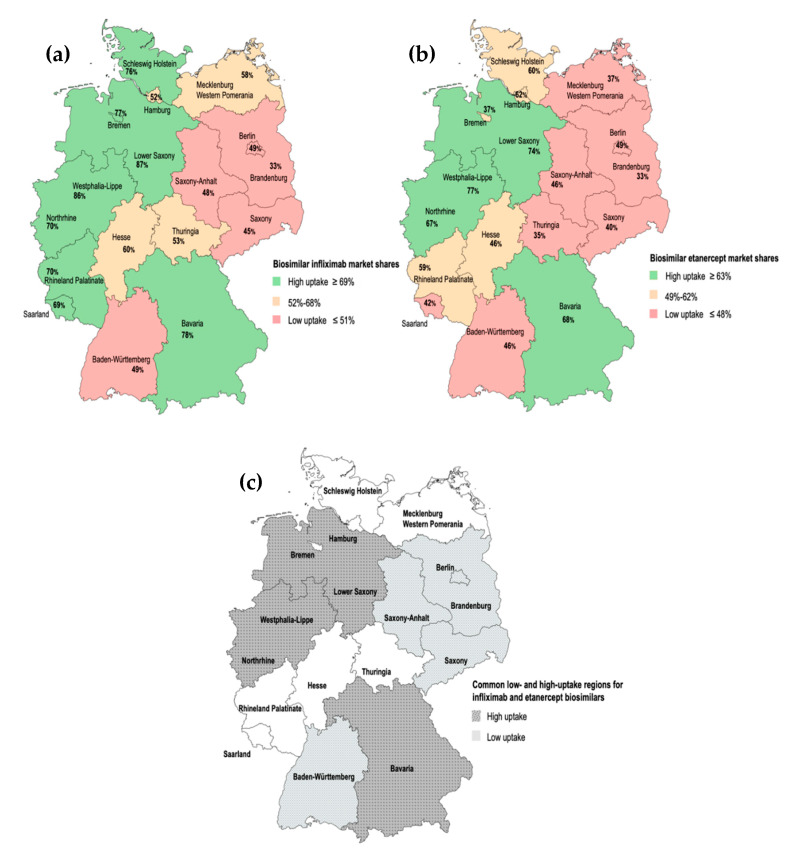
Figure 5.
(a) Market shares (%) of biosimilar infliximab in Q4 2018. (b) Market shares (%) of biosimilar etanercept in Q4 2018. (c) Low- and high-uptake PA regions which are common for infliximab and etanercept biosimilars in Q4 2018. The dotted pattern refers to regions with high biosimilar uptake for both infliximab and etanercept. The crossed pattern refers to regions with low biosimilar uptake for both infliximab and etanercept. The map templates were extracted from mapchart.net.

