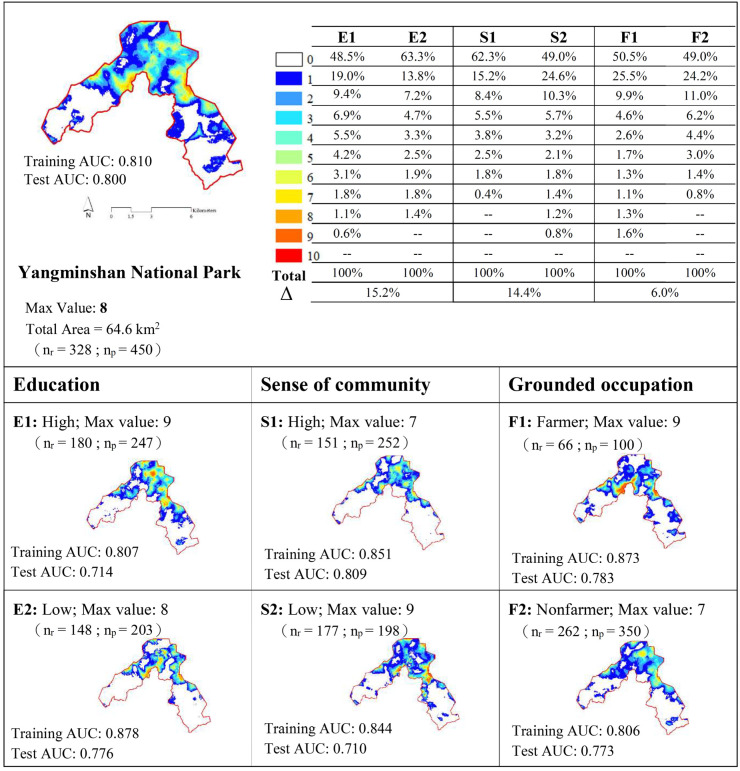
Figure 3.
Conservation values between pair assumptions. Note: AUC: area under the curve; %: percentage of total area; Δ: index of dissimilarity; nr: number of respondents; np: number of identified points; E1: high educational attainment; E2: low educational attainment; S1: high sense of community; S2: low sense of community; F1: farmer; and F2: nonfarmer.

