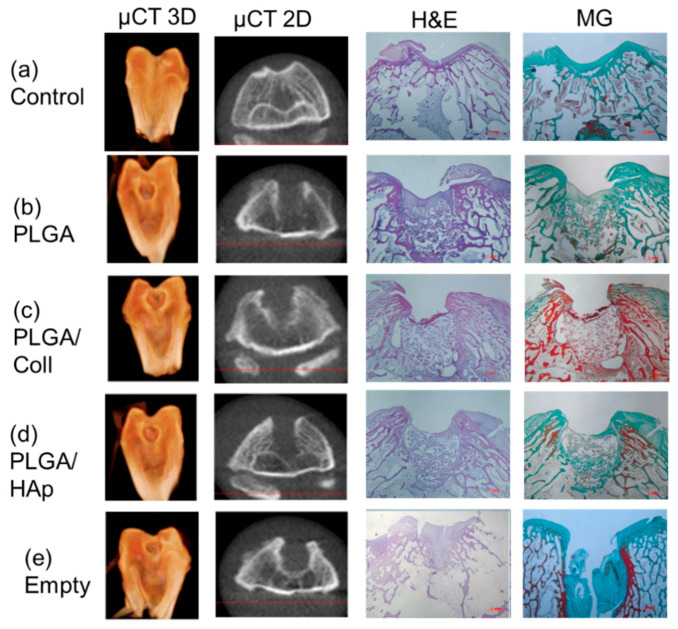
Figure 4.
Computer tomography in 3D and 2D projection (first and second column) and histological evaluation after hematoxylin and eosin (third column) and Masson-Goldner staining (fourth column) 4 weeks post-implantation: (a)—control, (b)—defect filled with PLGA scaffold, (c)—defect filled with PLGA/coll scaffold, (d)—defect filled with PLGA/HAp scaffold, (e)—empty defect.

