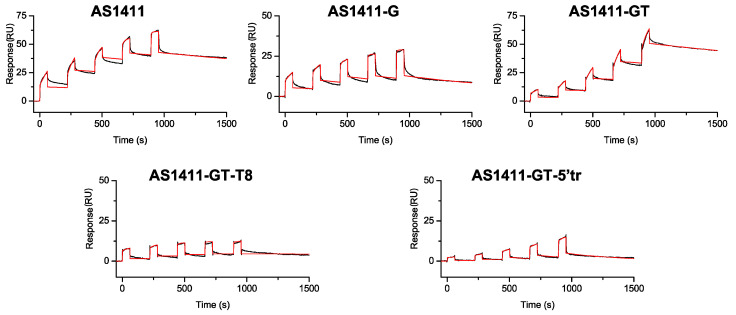
Figure 2.
Time evolution SPR sensorgrams obtained at 25 °C by injections of various concentrations (from 2 to 32 μM) of each investigated GROs on the chip-immobilized nucleolin with a contact time of 60 s and a flow rate of 30 μL/min. The sensorgrams are shown as black lines and their respective fits as red lines.

