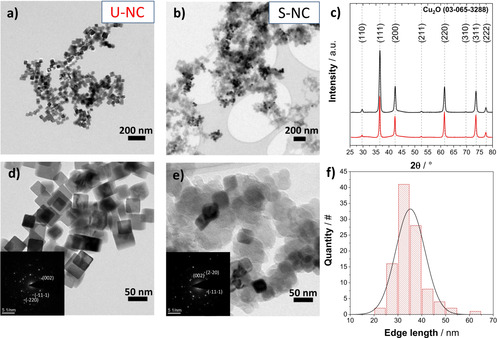
Figure 1.

Transmission electron microscopy (TEM) images of a),d) the unsupported Cu2O nanocubes, U‐NC, and b),e) the carbon‐supported Cu2O nanocubes (23 wt %), S‐NC. Insets in (d,e) show selected area electron diffraction (SAED) patterns of the respective material. c) X‐ray diffraction (XRD) patterns of both catalysts and f) particle size histogram derived from TEM images of the U‐NC.
