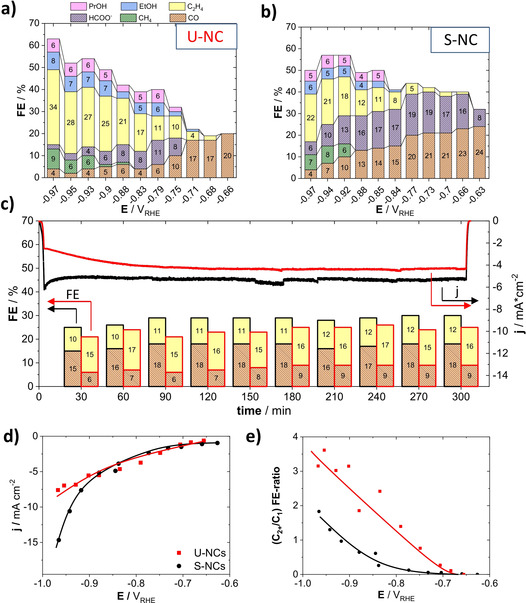
Figure 2.

a),b) Faradaic product efficiencies (FEs) as a function of the applied electrode potential after one hour of reaction time for a) the unsupported Cu nanocubes, U‐NC and b) the carbon‐supported Cu nanocubes (23 wt %), S‐NC. Color coded bars denote products as given in the legend. c) Chronoamperometric efficiency stability at a constant applied electrode potential of −0.86 VRHE for the U‐NC and the S‐NC catalysts. Colors as in (a). d) The electrochemical CO2 reduction polarization curves (geometric current‐density vs. IR‐corrected applied electrode potential) and e) (C2+/C1) FE ratios versus IR corrected applied electrode potential. Lines to guide the eye.
