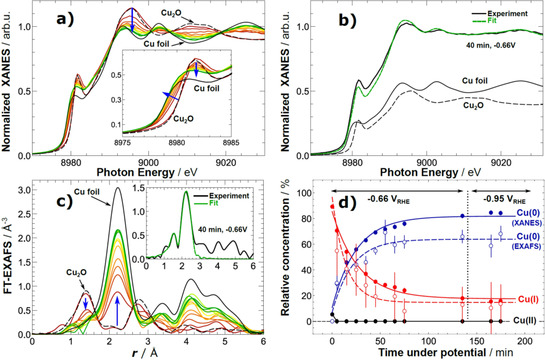
Figure 5.

a) Cu K‐edge XANES data of U‐NC sample acquired under operando CO2 reduction conditions. b) Representative example of catalyst XANES data fitting with a linear combination of reference spectra (the latter are also shown, scaled by their importance to the analyzed catalyst spectrum). c) Fourier‐transformed (FT) Cu K‐edge EXAFS data of U‐NC sample acquired under operando CO2 reduction conditions. Representative example of EXAFS data fitting is shown in the inset. d) Temporal evolution of the chemical composition of the Cu2O cubes during CO2 electroreduction obtained from the linear combination analysis of XANES data (filled circles) and coordination numbers from EXAFS data fitting (empty circles). Solid and dashed lines are guides for the eye. For additional reference spectra see Figure S9.
