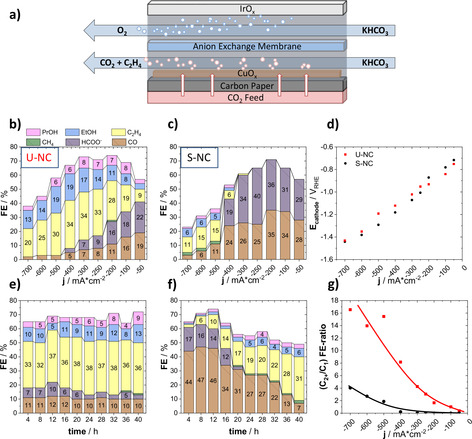
Figure 6.

a) Schematic representation of the electrolyzer flow cell. Faradaic product efficiencies as a function of applied geometric current density for b) the U‐NC and c) the S‐NC. e) 40 h stability test at −300 mA cm−2, displaying the Faradaic efficiency as a function of time for the U‐NC and f) the S‐NC. d) The electrolyzer polarization curves of U‐NC and S‐NC; g) (C2+/C1) product FE‐ratio for both catalysts.
