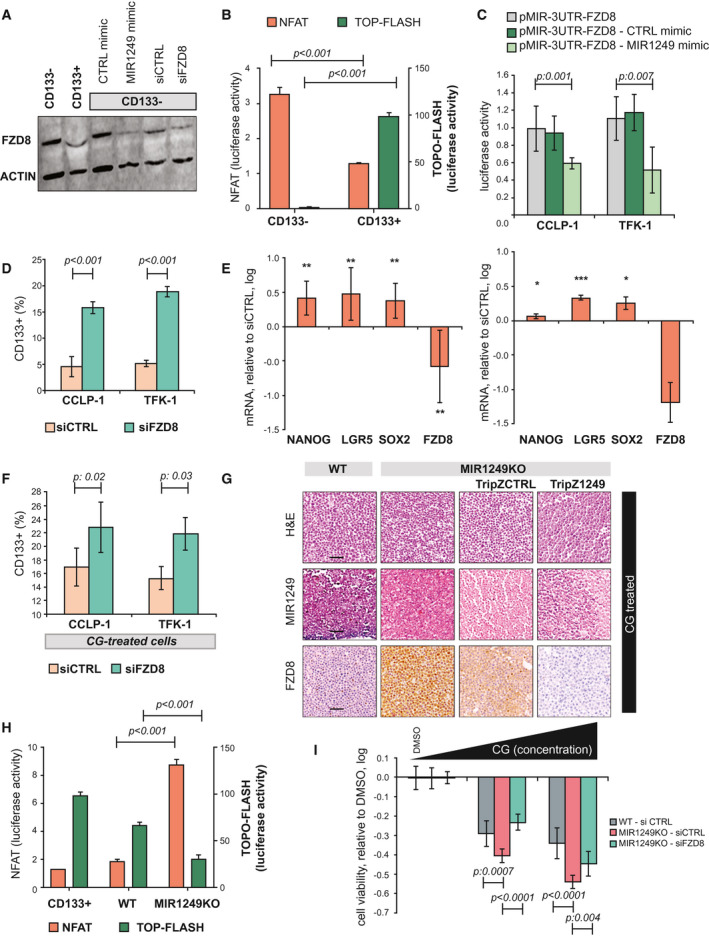
Figure 5.

MIR1249 activates the Wnt pathway by acting on FZD8. (A) CCLP‐1 cells were sorted for CD133 expression and processed for western blot analysis (left side). CD133‐ cells were also transfected with the indicated probes for 48 hours before proceeding to western blot (right side). (B) CCLP‐1 cells were sorted and transfected with nuclear factor of activated T cells (NFAT) and TOP‐Flash vector for 48 hours before luciferase activity was recorded. Bars indicate the mean of six independent experiments ± SD. Two‐way analysis of variance < 0.05. (C) BTC cells were transfected with pMIR‐3UTR‐FZD8 vector ± MIR1249 mimic, and the luciferase activity was recorded. Bars indicate the mean of six independent experiments ± SD. (D) BTC cells were transfected for 48 hours, and positivity for CD133 was assessed by FACS. Bars represent the mean of three independent experiments ± SD. (E) CCLP‐1 (left) and TFK‐1 (right) cells were transfected with small interfering FZD8 or small interfering CTRL for 48 hours and collected for mRNA expression by TaqMan assay. Bars represent the log value of the ratio between siFZD8 and siCTRL. Bars indicate the mean of three independent experiments ± SD. *P < 0.05; **P < 0.01; ***P < 0.001. (F) CG‐treated BTC cells were transfected for 48 hours, and positivity for CD133 was assessed by FACS. Bars represent the mean of three independent experiments ± SD. (G) CCLP‐1 cells were infected with the indicated vectors and treated with CG chemotherapy before being fixed in formalin and embedded in paraffin for immunohistochemistry and ISH (see also Supporting Table S4). Scale bars: 100 μm. (H) Cells were transfected with NFAT or TOP‐Flash vectors, and luciferase activity was recorded after 48 hours. CD133+ cells were added as controls. Bars indicate the mean of three independent experiments ± SD. (I) CCLP‐1 cells were transfected for 48 hours and treated with DMSO or increasing doses of CG (up to 5 μM cisplatin and 50 nM gemcitabine). Bars represent the log value of the ratio between CG‐treated and DMSO‐treated cells. Bars indicate the mean of six independent experiments ± SD. Abbreviations: LGR5, leucine‐rich repeat‐containing G protein‐coupled receptor 5; siCTRL, small interfering CTRL; siFDZ8, small interfering FDZ8; SOX2, SRY (sex determining region Y)‐box 2.
