
Figure 6.
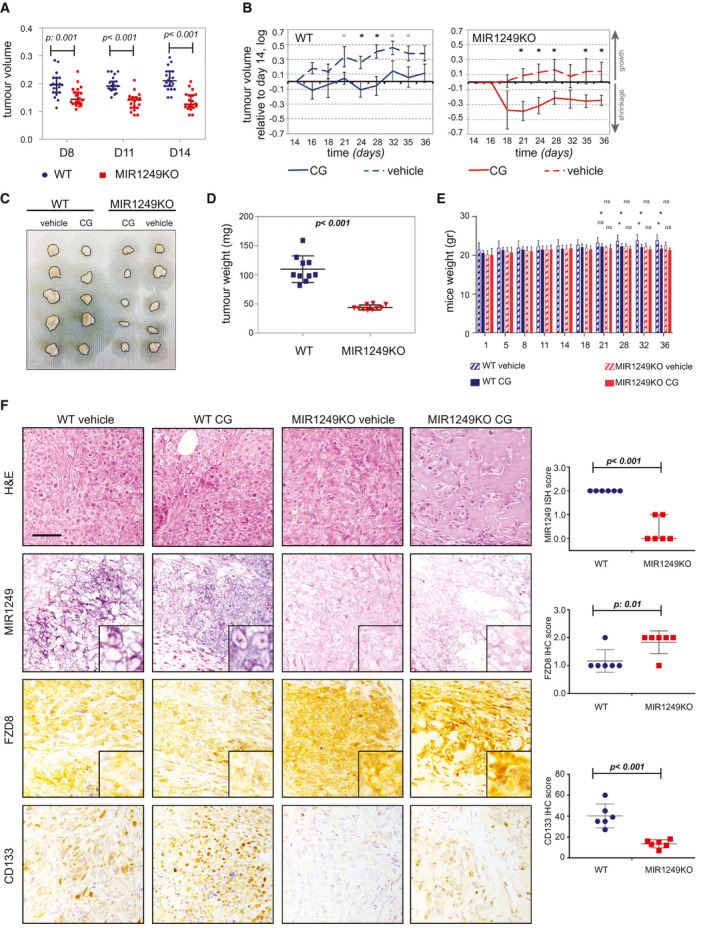
Lack of MIR1249 increases sensitivity to chemotherapy in vivo. (A) WT or MIR1249KO CCLP‐1 cells were injected subcutaneously in the flank of NSG (nonobese diabetic scid gamma) mice (n = 20 each) and monitored for growth by caliper (see also Supporting Fig. S4). (B) At day 14, mice were randomized to be treated with a weekly combination of intraperitoneal gemcitabine (150 mg/kg) and cisplatin (2 mg/kg) or vehicle alone for 3 weeks before being sacrificed. Data are presented normalized to baseline pretreatment tumor size (day 14). Black * indicates P value < 0.05; gray * indicates P value between 0.05 and 0.085 (see also Supporting Table S5). (C) Representative pictures of five explanted tumors per group. (D) Explanted tumors of CG‐treated mice were weighted before being stored for analyses. Error bars indicate the mean with SEM. (E) Mice were weighted periodically over the course of treatment. Bars represent the mean of 10 mice ± SD. *P < 0.05. (F) Representative pictures of MIR1249 ISH staining and immunohistochemistry staining for the indicated proteins performed on the explanted tumors, along with quantitative analysis. Scale bars: 100 μM. Three mice per group were analyzed (for a total of 12), and CG‐treated and vehicle‐treated tumors were grouped to assess the differences between KO and WT. Abbreviations: H&E, hematoxylin and eosin; ns, not significant.