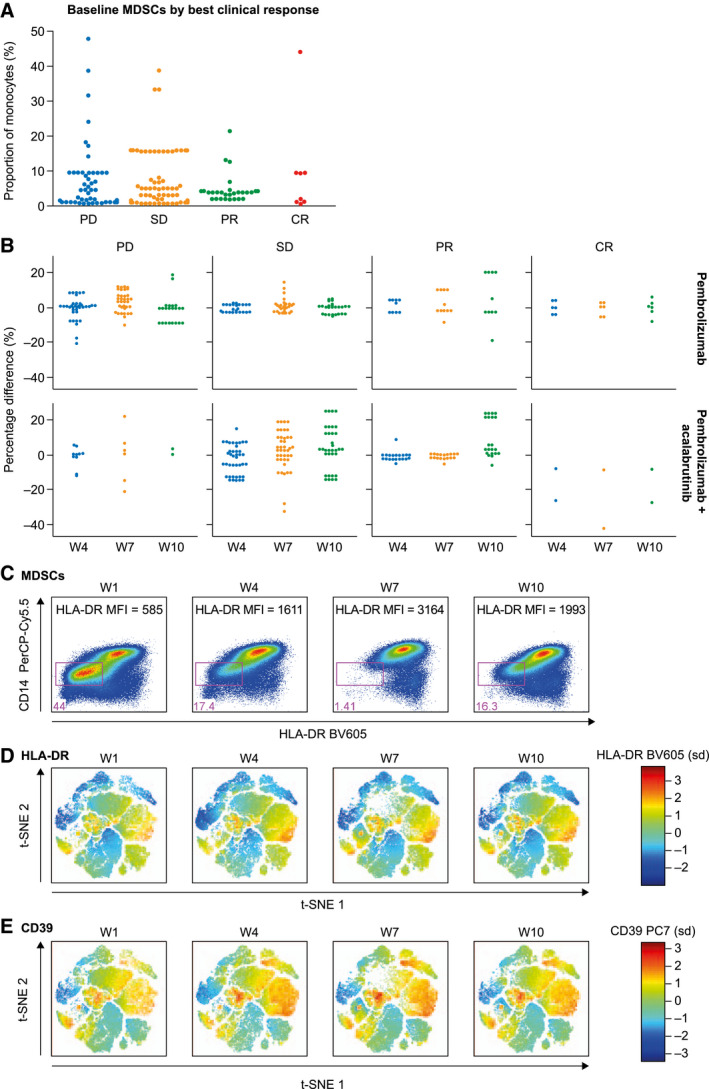
Figure 2.

(A) Baseline monocytic MDSCs based on clinical responses and (B) changes during treatment in comparison with the baseline based on the treatment cohort and the best clinical response. (C) Peripheral MDSCs of an exceptional responder to pembrolizumab and acalabrutinib depicted by flow cytometry and (D,E) t‐SNE plots by HLA‐DR and CD39, respectively. CR indicates complete response; MFI, median fluorescent intensity; MDSC, myeloid‐derived suppressor cell; PerCP‐Cy5.5, PerCP (Peridinin chlorophyll)‐Cy5.5; PD, progressive disease; PR, partial response; SD, stable disease; t‐SNE, t‐distributed stochastic neighbor embedding.
