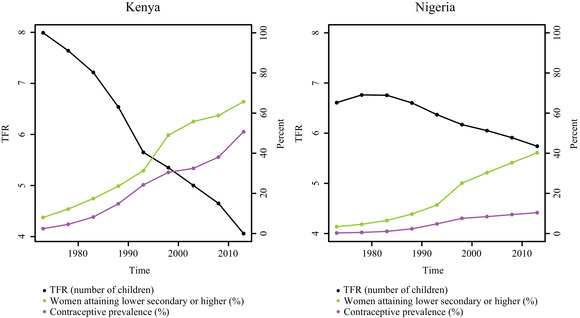
FIGURE 1.

TFR (black), percentage of women who have attained at least lower secondary education or higher (green), and contraceptive prevalence (purple) for Kenya from 1970–1975 to 2010–2015 and Nigeria from 1975–1980 to 2010–2015

TFR (black), percentage of women who have attained at least lower secondary education or higher (green), and contraceptive prevalence (purple) for Kenya from 1970–1975 to 2010–2015 and Nigeria from 1975–1980 to 2010–2015